
MSAMP5 Step-Up Jump Notes with Auto-Callable Feature — Evaluation
Term: up to 7 years (pricing 27-Oct-2026, maturity 1-Nov-2033) Currency: USD Stated principal: $1,000 per note
1. Headline Simulation Results
| Metric | Structured Product | Underlying Benchmark (Total Return) |
|---|---|---|
| Expected annualized return | 14.77% | 12.39% |
| Probability of negative annualized return | 0.00% | 1.05% |
| 99% confidence VaR (1 year) | 0.00% | -0.13% |
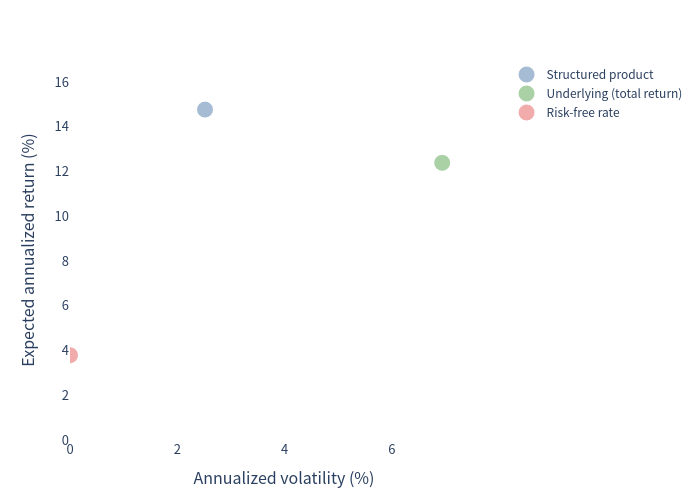
| Expected annualized volatility | 2.52% | 6.94% |
- Expected total return over the realized holding period: +20.43%, over an expected holding period of ~1.5 years (≈18 months).
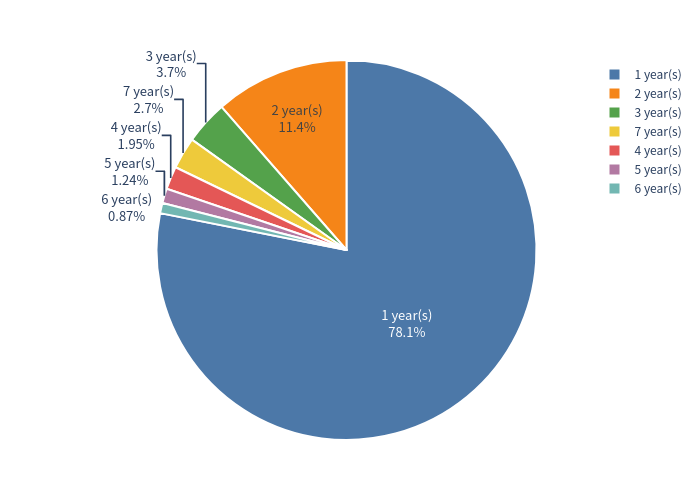
- The note is auto-called in 97.3% of simulated paths (78.1% after year 1, 11.4% after year 2, and a long tail thereafter). Only ~2.7% of paths run the full 7 years to maturity.
- Because the note returns at least par at maturity and every call level is positive, the simulated nominal loss probability is 0% — the "worst case" is simply getting the $1,000 principal back (a 0% total return, occurring in ~1.9% of paths).
2. Basic Product Information & Mechanics (Plain Language)
What it is. A principal-protected, auto-callable "step-up" note linked to a single proprietary index (the Morgan Stanley Amplitude Index). It pays no periodic interest; all return comes from a single redemption payment.
How it works, step by step:
- You invest $1,000 per note.
- Annual auto-call check. On each anniversary (years 1–6) the note checks whether the index level is at or above a slowly rising trigger (100.75% of the start after year 1, 101.50% after year 2, … 104.50% after year 6). If it is, the note is automatically redeemed early and pays a fixed step-up amount equal to 15.5% per year held — i.e., $1,155 after 1 year, $1,310 after 2 years, … up to $1,930 after 6 years.
- If it is never called, at maturity (7 years) you receive $1,000 × (1 + index return) — full 1-for-1 (uncapped) upside — but if the index is down, you still get your $1,000 principal back (the downside is floored at par).
- There is no barrier / knock-in and no coupon.
In short: you give up interest income and the more generous compounding of a direct investment, and in exchange you receive a fixed 15.5% annualized "step-up" if the index merely ticks up, plus par protection if it doesn't.
3. Simulation Outcome — Scatter of Product vs Underlying
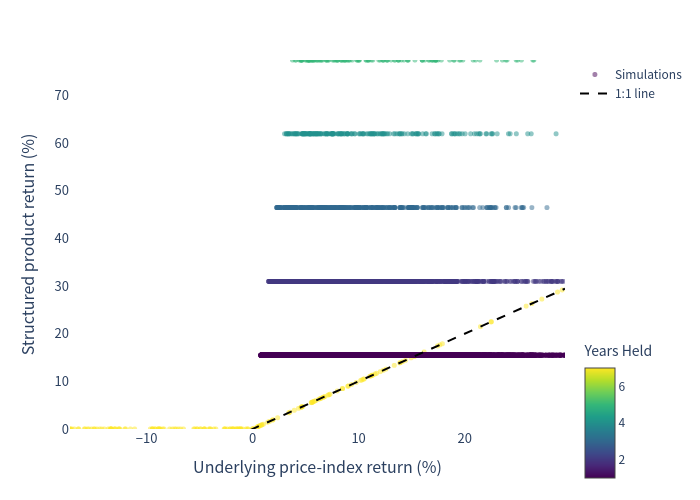
Each dot is one of 10,000 simulated paths. The x-axis is the underlying's price-index return and the y-axis the note's return at the month the note exited; colour shows how many years the note was held. The clustering of dots on the flat line at ~15.5% shows the large majority of paths being called at year 1.
4. Return Distributions
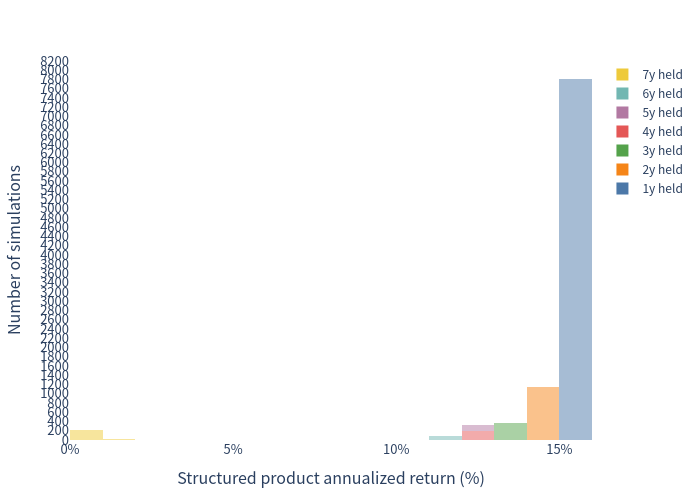
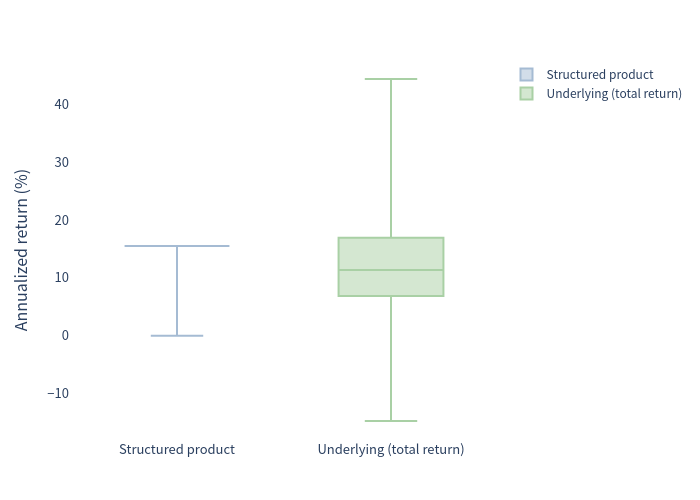
Structured product annualized return. The distribution is concentrated just below +15.5% (the fixed per-annum step-up earned by the vast majority of paths called in years 1–2), with a small left tail of paths that ran to maturity and returned par (0%).
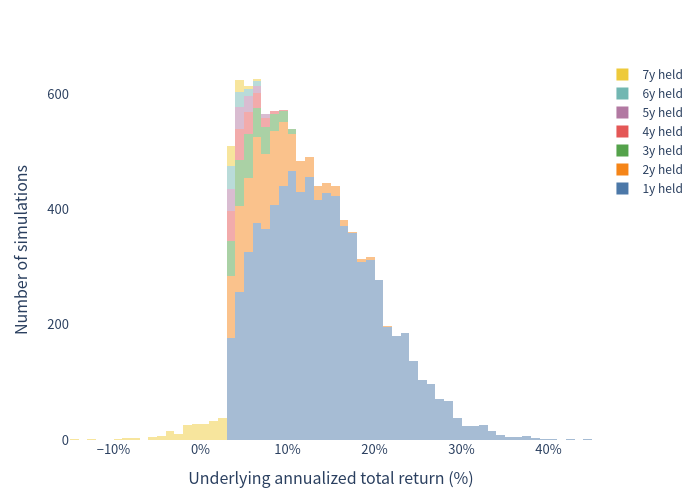
Underlying benchmark annualized total return. A wide bell-shaped distribution (roughly -15% to +45%), reflecting genuine equity-like market risk that the note largely neutralizes.
5. Scenario Probabilities
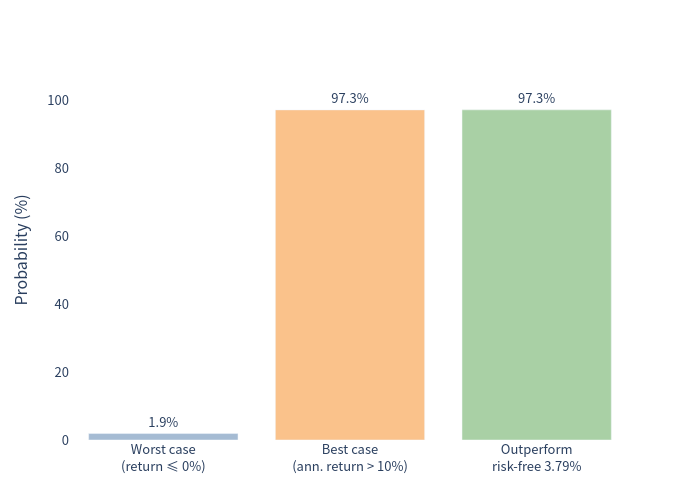
- Worst case (total return ≤ 0%): 1.91% — these are paths that were never called and finished at or below the starting level, so the investor simply receives par back.
- Best case (annualized return > 10%): 97.30% — reached whenever the note is called at the 15.5% step-up.
- Outperform the risk-free rate (3.79%): 97.31%.
6. Risk vs Return
Plotted on the same scale, the note sits far to the upper-left of the underlying: a higher expected return with markedly lower volatility, thanks to its par floor and the fixed step-up call. The risk-free rate anchors the bottom-left.
The box plot below contrasts the tight, almost fixed return of the note (spanning 0%–15.5%) with the much wider dispersion of the underlying benchmark.
7. Holding-Period Profile
Because the note auto-calls as soon as the index is marginally above its start, it is short-dated in most cases: ~78% of paths end after just one year, and the number of paths surviving each year falls quickly.
8. Investment Commentary
Strengths
- Principal protection at maturity. The worst simulated outcome is receiving par; the note returned par or better in every one of the 10,000 paths.
- High, fixed step-up. A 15.5%-per-annum step-up is attractive relative to the underlying benchmark's ~12.4% expected annualized total return.
- Low trigger hurdle. The index needs to be only 0.75% above its starting level in year 1, rising to 4.50% by year 6 to trigger the step-up, so the payout is realized in the large majority of scenarios.
Considerations
- Return is capped by the call. Once called, the note pays the fixed step-up and stops — any further index upside is forgone (the "+60% → $1,600" upside only matters in the small minority of paths that run to maturity).
- Short expected life / reinvestment. With an expected life of ~1.5 years, the investor faces reinvestment risk: the appealing 15.5% step-up applies only while the note is outstanding.
- Embedded cost. The issuer's estimated value of $874.80 versus the $1,000 issue price represents a ~12.5% upfront gap. This simulation deliberately excludes costs, so the modelled returns overstate what an investor paying full price would realize.
- New, proprietary index. The underlier was established on 5-Jan-2026 and has essentially no track record; it embeds its own costs and uses momentum/volatility-targeting rules that may not reproduce historical behaviour.
This evaluation is a quantitative simulation and does not constitute financial advice or a suitability assessment.
9. Benchmark & Methodology Note
The Underlier is a proprietary, multi-asset, momentum- and volatility-targeted index that is not publicly quoted and has negligible history. To produce the analysis it is therefore approximated by a broad, balanced multi-asset (≈60/40) index, dividend yield ≈2.5%. The risk-free rate is the 1-year average 1-year U.S. Treasury bill yield (3.79%). Paths are simulated monthly out to 84 months with a drift of risk-free + 4.0% (≈7.8% p.a.) and GARCH-based volatility, and the note's payoff is applied strictly on its annual observation dates.