
11.70% p.a. Multi Barrier Reverse Convertible — Alcon / Roche / Straumann / Swiss Re (Callable, CHF)
Headline Simulation Results
The product pays a fixed 11.70% p.a. coupon (quarterly, CHF 29.25 per CHF 1,000) regardless of underlying performance, while redemption at maturity depends on a 55% barrier monitored continuously on all four underlyings. The Issuer additionally holds the right to call the product early (quarterly from March 2027).
Basic Product Information
| Type | Yield-Enhancement Reverse Convertible (SSPA 1230), issuer-callable, continuous multi-barrier observation |
|---|---|
| Underlyings (CHF) | Alcon Inc, Roche Holding, Straumann Holding, Swiss Re — payoff depends on the worst performer at maturity, while barrier survival requires all four to stay above 55% of their initial level |
| Coupon | 11.70% p.a. → CHF 29.25 per quarter per CHF 1,000 (7 coupon dates: Dec-2026 → Jun-2028); paid in any case unless the product is called early |
| Barrier | 55% of initial fixing level, continuous observation 11/09/2026 – 09/06/2028 |
| Maturity | Final fixing 09/06/2028; redemption 16/06/2028 |
| Currency / Denomination | CHF / CHF 1,000 (Issue Price 100%) |
How it works (layman explanation)
You lend CHF 1,000 and receive a high quarterly coupon of CHF 29.25 (2.925% per quarter, ~11.7% per year) for up to ~21 months. In exchange you accept two types of risk:
- Issuer call risk: the Issuer may repay your CHF 1,000 early (on a quarterly observation date, starting Mar-2027, together with the coupon then due) and stop paying coupons thereafter. This usually happens when markets are healthy.
- Barrier / delivery risk: if any one of the four stocks ever closes at or below 55% of its starting level during the observation period, your capital is no longer guaranteed at maturity. If, in addition, the worst-performing stock finishes below its start level (100%), you receive shares (or equivalent cash) of that worst stock — worth less than your CHF 1,000. If the worst stock has recovered to at/above its start level, you still get your full CHF 1,000 back.
So the coupon is attractive, but in a tail scenario where one of the four stocks collapses and stays depressed, you can lose part of your capital. Upside is capped: you never participate in stock gains beyond the fixed coupon.
Key Statistics (Annualized)
| Metric | Structured Product | Underlying basket (total return)1 |
|---|---|---|
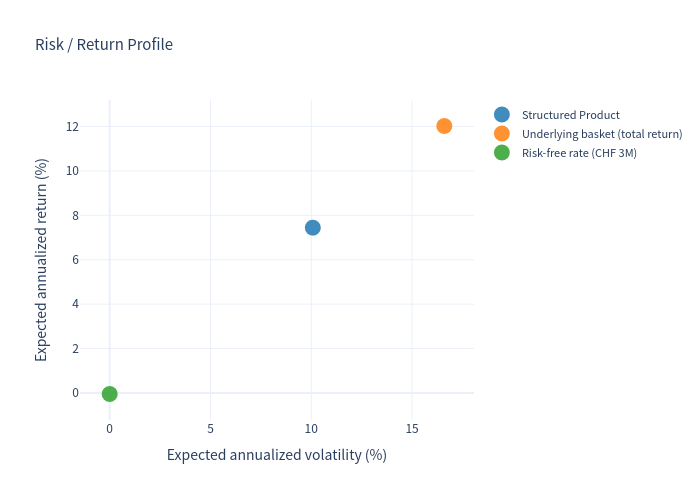
| Expected annualized return | 7.44% | 12.02% |
| Expected annualized volatility | 10.08% | 16.60% |
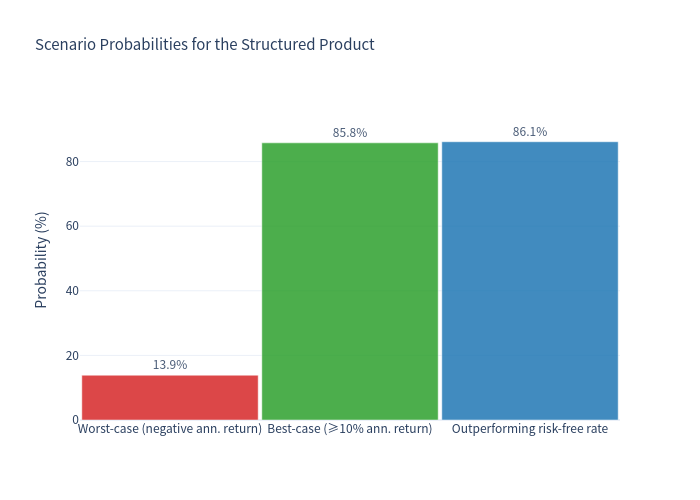
| Probability of loss | 13.87% | 24.47% |
| 99% confidence VaR (1 year) | −26.46% | −17.00% |
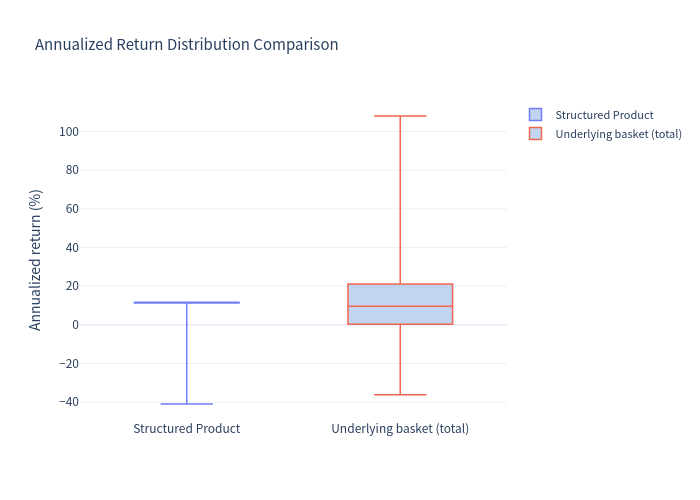
| Median annualized return | 11.23% | 9.57% |
1 Equal-weight basket of the four underlyings (Alcon, Roche, Straumann, Swiss Re), including dividends (~2.16% p.a.).
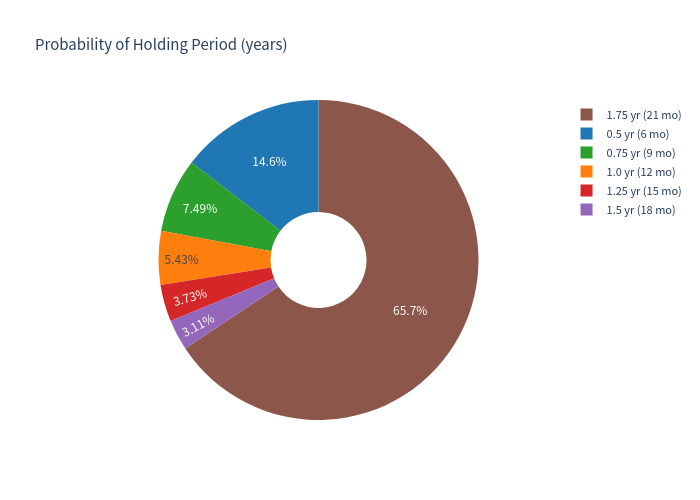
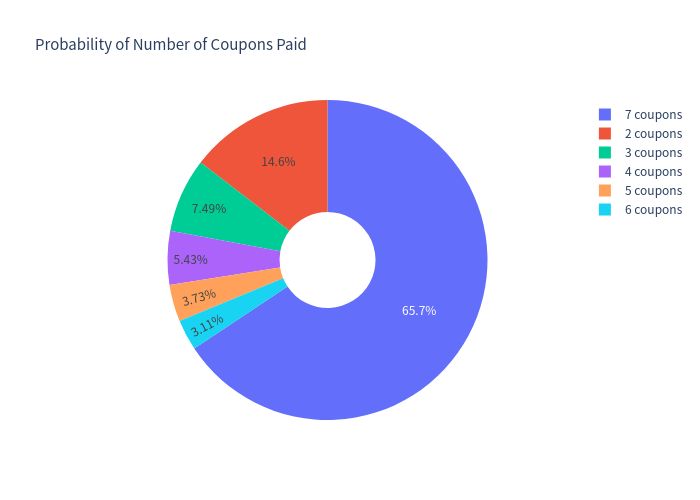
Additional realized-horizon figures: expected total return over the realized holding period ≈ 9.98% (product) vs 11.51% (underlying basket incl. dividends); expected holding period ≈ 17.11 months; average number of coupons received ≈ 5.70; probability of being held to maturity (Jun-2028) ≈ 65.66%; probability of early issuer call ≈ 34.34%.
Charts
Simulation outcomes scatter
Each dot is one simulated path; the 1:1 line marks what the investor would have earned if the product simply tracked the equal-weight underlying basket.
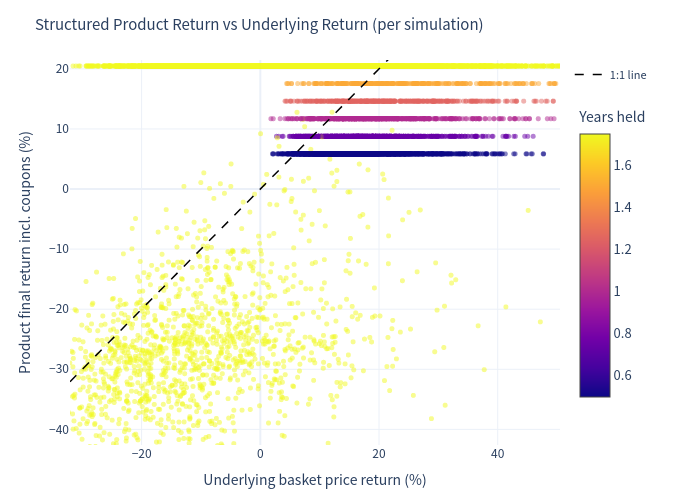
Each dot is one simulated path. The 1:1 line marks the return the investor would have earned if the product simply tracked the equal-weight underlying basket. The product clusters at its fixed-coupon levels while the left tail reflects barrier/delivery losses.
Product return distribution
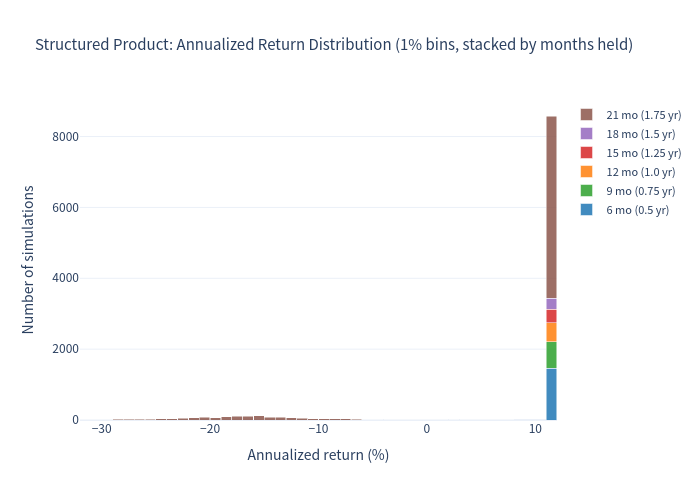
Underlying basket return distribution
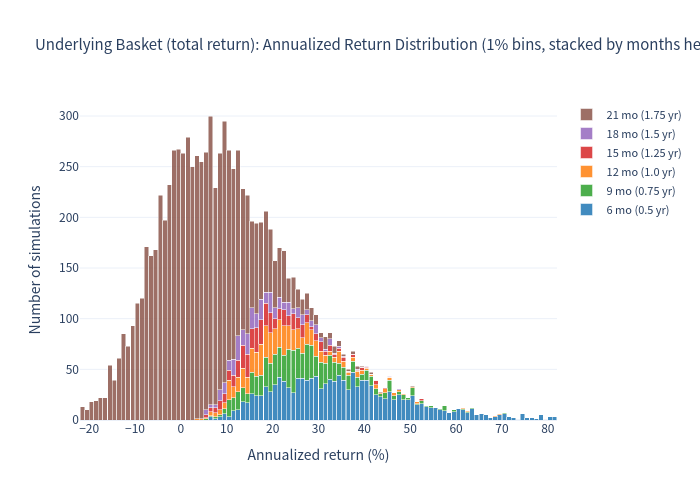
Annualized return distributions (1% bins), coloured by the number of months the position was held.
Scenario probabilities
Risk-return scatter
Box plot comparison
Holding period distribution
Coupon count distribution
Investment Commentary
Considerations
- Upside is capped: no participation in stock appreciation; expected annualized return (7.44%) is below the expected return of holding the stocks directly (12.02%) because the embedded barrier puts and issuer-call feature are monetised through the coupon.
- The left tail is severe: 99% VaR of −26.46% (annualized) is worse than the underlying basket's −17.00%, driven by loss scenarios where the worst stock finishes well below its start level (simulated redemption values as low as ~19 index-points).
- Issuer-call feature shortens the average holding period to ~17 months and stops the coupon stream early in healthy markets (~34% of scenarios) — modelled here as an economically motivated issuer call (no market trigger is defined in the term sheet).
- The product carries issuer credit risk (Leonteq, BBB-).
Positives worth noting