
15.60% p.a. Multi Barrier Reverse Convertible — Simulation & Risk Analysis
Product: 15.60% p.a. Multi Barrier Reverse Convertible (callable, Quanto USD) on Anglo American, Freeport-McMoRan and Southern Copper · ISIN CH1555867097 · Issuer: Basler Kantonalbank
Headline Simulation Results
| Metric | Value |
|---|---|
| Expected annualized return | 11.67% |
| Expected total return over realized holding period | 10.98% |
| Expected holding period | 12.58 months |
| Probability of negative total return | 10.01% |
| 99% confidence VaR (1-year, annualized) | -30.20% |
| Median annualized return | 15.32% |
| Probability of annualized return > 10% | 89.87% |
| Probability of outperforming risk-free rate (3.72%) | 89.91% |
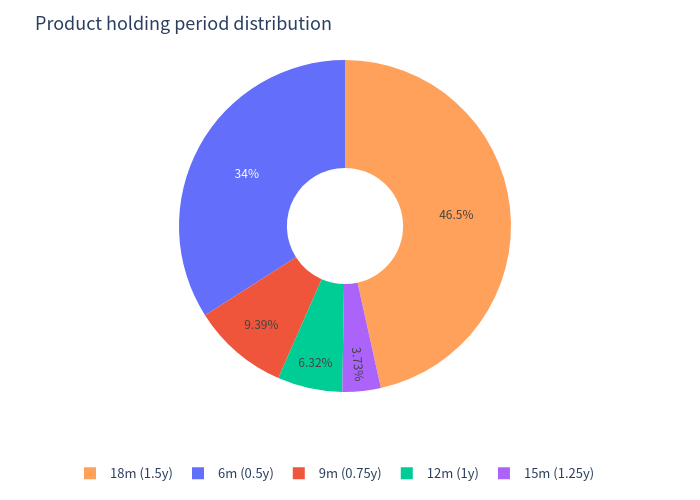
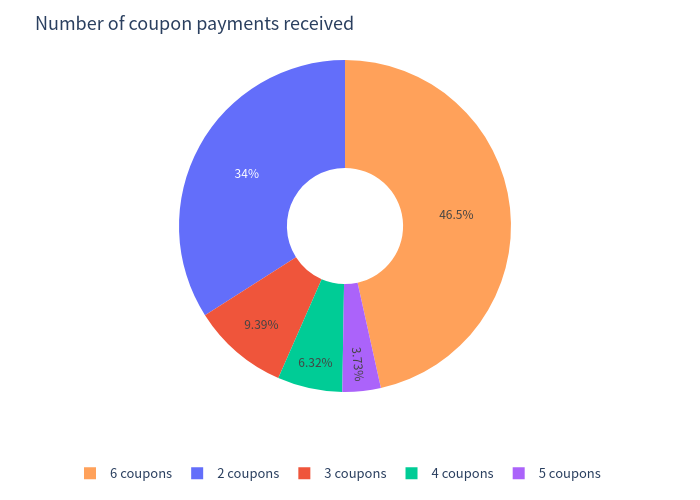
The product is expected to be redeemed early by the issuer in 53.47% of simulations (typically after the underlying basket has rallied), which keeps the average holding period at about 12.58 months. Annualized figures should therefore be read together with the holding period: on paths held a full 18 months the maximum total return is 23.40% (six coupons of 3.90% each plus par), while on paths redeemed early the coupon income is simply spread over a shorter period.
Basic Product Information
How it works
- The investor receives a fixed coupon of 3.90% per quarter (15.60% p.a. in total), paid every 3 months regardless of how the three mining/copper stocks perform, for as long as the product is outstanding.
- Capital at maturity (18 months) is returned at par (100%) unless a "Barrier Event" occurs, i.e. at least one of the three underlyings trades at or below 49% of its starting level at any time during the observation period.
- If no barrier event occurs, the investor gets 100% of capital back plus all coupons.
- If a barrier event occurs and the worst-performing underlying finishes below its starting level, the investor receives physical shares of that worst performer — i.e. capital is converted and a loss is realized equal to the fall of the worst stock.
- If a barrier event occurs but the worst performer still finishes above its start, capital is repaid at par.
- The issuer may call (redeem) the product early at each quarterly date from month 6 onward, repaying par plus that quarter's coupon. In this simulation the issuer is assumed to call once the worst-performing underlying is back at/above its starting level (an economically rational refinancing point).
- All payments are in USD with quanto FX protection, so currency moves do not affect the payoff; the product is quoted on 100 = initial level.
Underlyings
| Underlying | Currency | Barrier | Strike |
|---|---|---|---|
| Anglo American PLC | GBp | 49.00% | 100.00% |
| Freeport-McMoRan Inc | USD | 49.00% | 100.00% |
| Southern Copper Corp | USD | 49.00% | 100.00% |
Key Statistics — Structured Product vs Underlying Benchmark
The underlying benchmark is the equal-weight basket of the three stocks (total return, dividends reinvested), measured over the same horizon as each simulated product holding period.
| Metric | Structured product | Underlying benchmark (total return) |
|---|---|---|
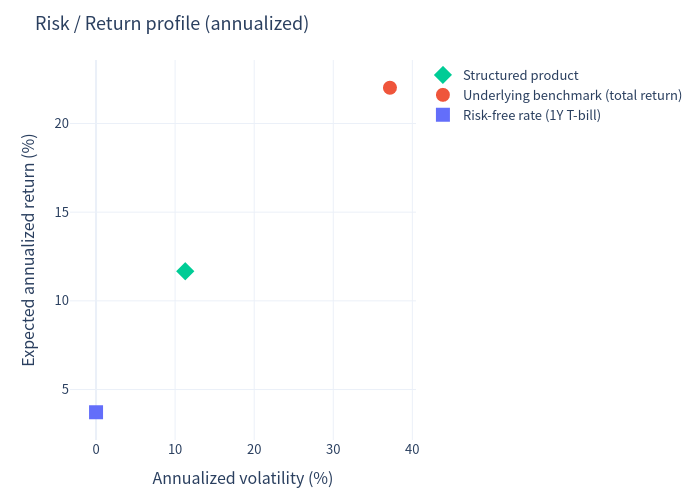
| Expected annualized return | 11.67% | 22.01% |
| Expected annualized volatility | 11.27% | 37.17% |
| Probability of loss | 10.01% | 31.53% |
| 99% VaR (1-year, annualized) | -30.20% | -38.88% |
| Mean total return over realized holding period | 10.98% | 10.74% (price-only: 9.42%) |
The benchmark's mean annualized return of 22.01% is measured over the same (call-dependent) horizons as the product. Because the issuer redeems the product early precisely when the basket has rallied strongly, those benchmark windows are "cherry-picked" strong short windows and their annualized returns look very high. On an unconditional fixed 18-month horizon the basket's expected annualized total return was 9.40% (volatility 26.55%, loss probability 39.73%, 99% VaR -39.53%). The structured product's expected annualized return of 11.67% is achieved with roughly one-third to one-quarter of the benchmark's volatility and a far lower loss probability.
Charts
Simulation outcomes — product return vs underlying return
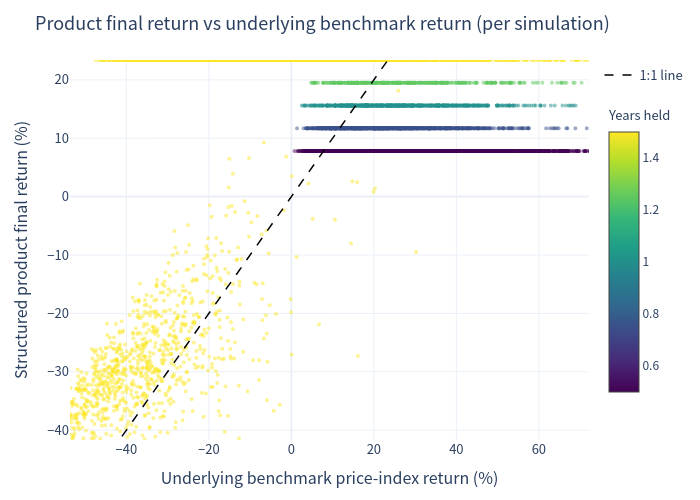
Each dot is one simulation; the colour shows how long the product was held. The dashed 1:1 line shows where the product return would equal the underlying basket price return. Points to the left/above the line are cases where the product's coupons and barrier protection beat the basket; points to the right/below are capped-upside cases where the basket rallied and the product was called or matured at par.
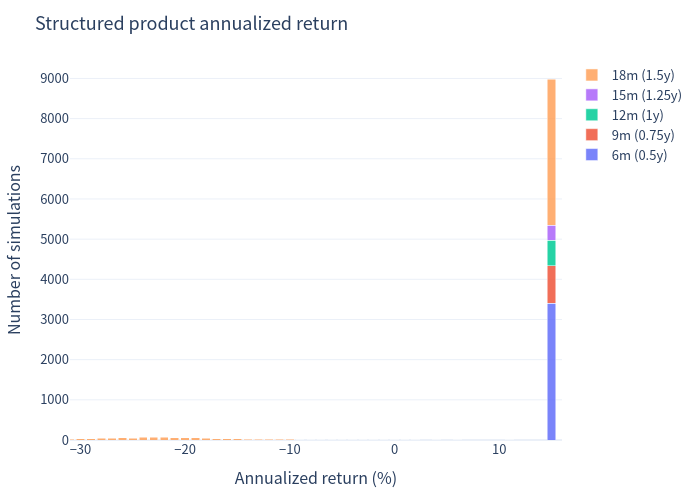
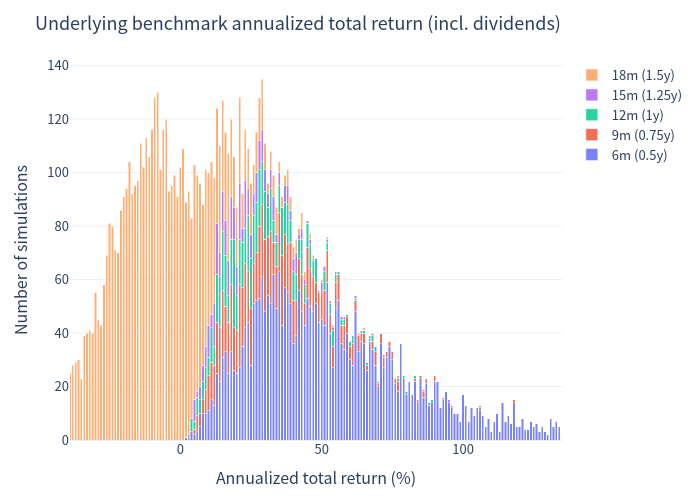
Annualized return distributions (1% bins)
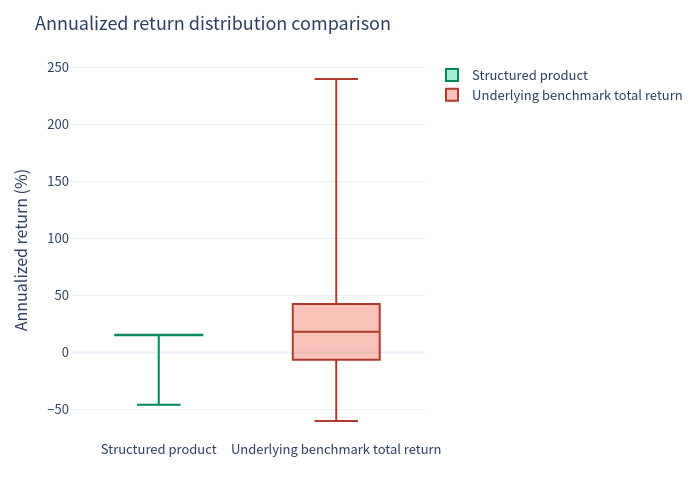
The structured product's annualized returns are tightly clustered around the coupon rate (15.60% p.a.), with a left tail from barrier/share-delivery losses. The underlying basket shows a far wider dispersion; bar colour indicates the holding period.
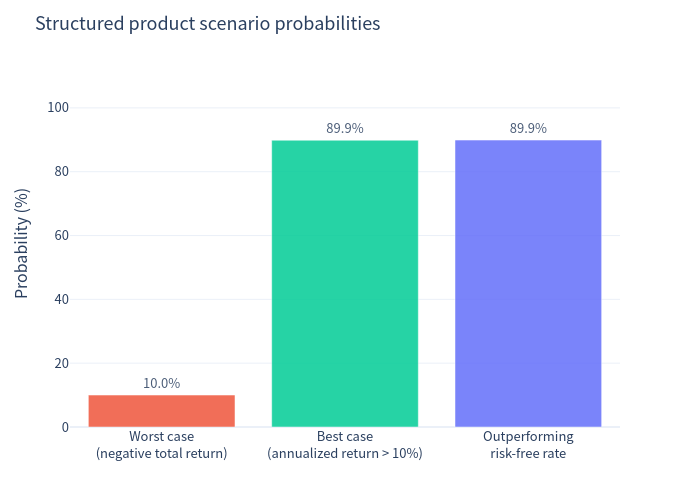
Scenario probabilities
Frequency of the main simulation outcomes: early redemption, barrier touch, share delivery and loss scenarios.
Risk / return profile (annualized)
Annualized return against annualized volatility for the structured product and the underlying benchmark.
Annualized return comparison (box plot)
Distribution comparison of annualized returns between the structured product and the underlying basket.
Holding period and coupon outcomes
Distribution of the realized holding periods and of the number of coupons received across simulations.
Investment Commentary
Attractive points
- High contractual income: 15.60% p.a. (3.90% per quarter) paid in any market condition while outstanding — in 89.91% of simulations the product beats a 3.72% risk-free return.
- Losses require a very severe move: a barrier event needs at least one stock to fall > 51% from its initial level (observed in 10.64% of simulations); only then, if the worst stock also ends below its start, is capital converted into shares (loss scenario in 10.14% of simulations). In the loss scenario the coupons already received cushion the capital loss.
- Strong downside-risk reduction vs the underlying basket: probability of loss 10.01% vs 31.53% for the basket, with annualized volatility of 11.27% vs 37.17%.
- Early-redemption feature shortens average capital lock-up to ~12.58 months while the full coupon for the redemption quarter is still paid.
Trade-offs (risk considerations)
- Upside is capped: in strong markets the product is called at par and returns only the fixed coupons, whereas holding the basket would have captured the rally (the same-horizon benchmark mean of 22.01% reflects exactly these strong called windows).
- Tail risk is meaningful but rare: worst simulated total return was -60.22%, and the 1-year 99% VaR is -30.20% — the product is exposed to a deep single-name copper/mining crash.
- The call feature is controlled by the issuer, not the investor, so the investor cannot choose to stay invested when conditions are favourable.
- The product carries issuer credit risk (Basler Kantonalbank) and early redemption shortens the income stream versus holding to maturity.
This analysis is a quantitative evaluation of the contractual payoff under simulated market scenarios. It does not constitute investment advice or a suitability assessment.