
1. Headline Simulation Results
| Metric | Result |
|---|---|
| Expected annualized return | 10.56% |
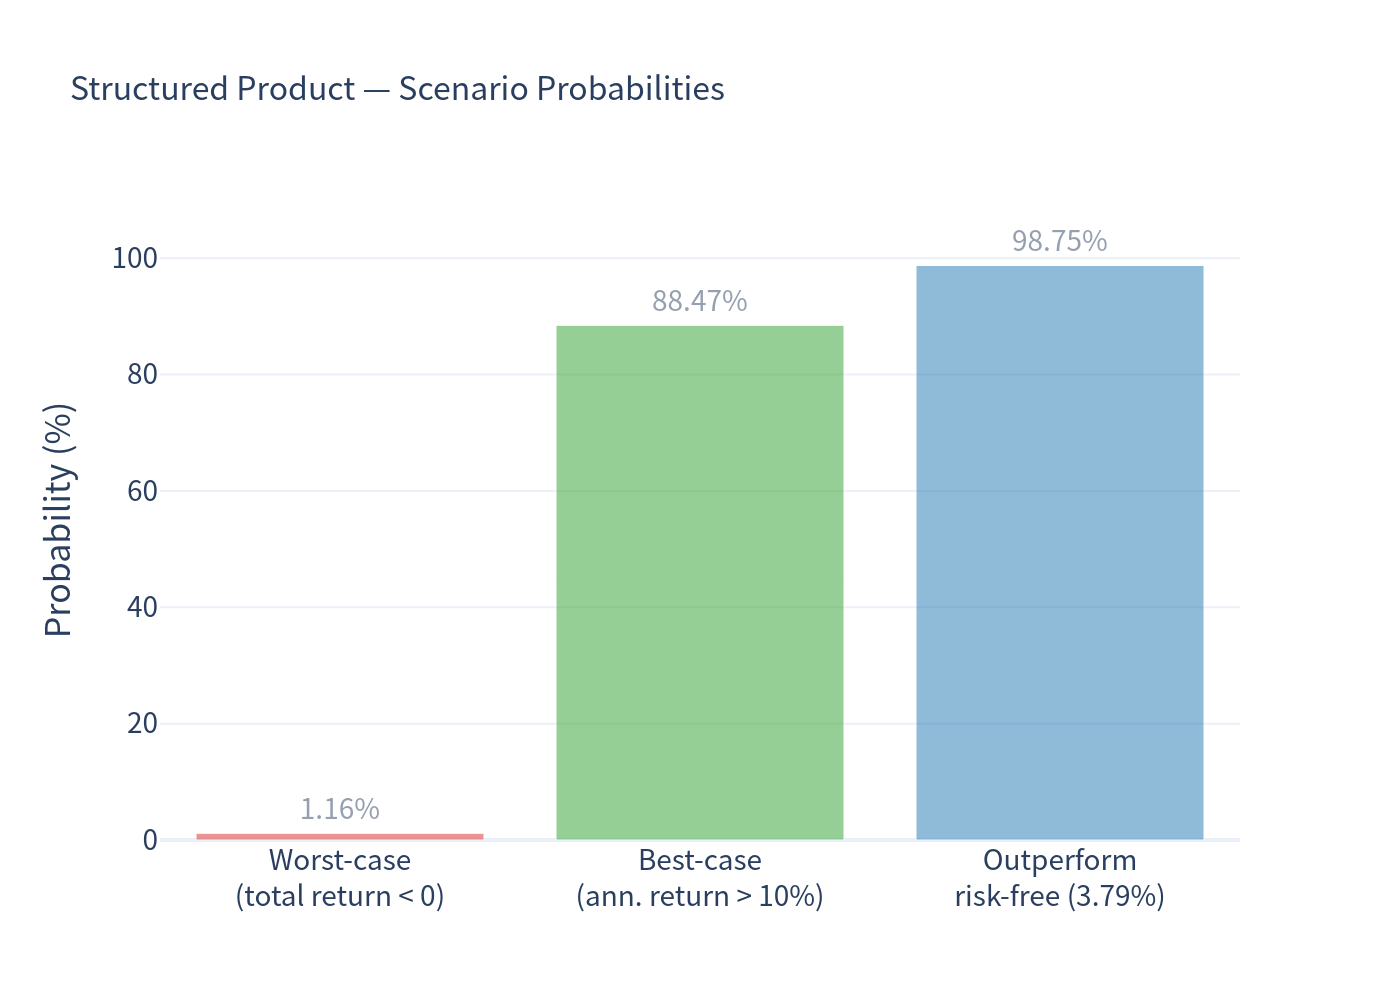
| Probability of negative return | 1.16% |
| 99% confidence VaR (1-year) | -1.19% |
| Expected annualized volatility | 1.91% |
| Probability of outperforming the risk-free rate (3.79%) | 98.75% |
| Probability of earning > 10% annualized | 88.47% |
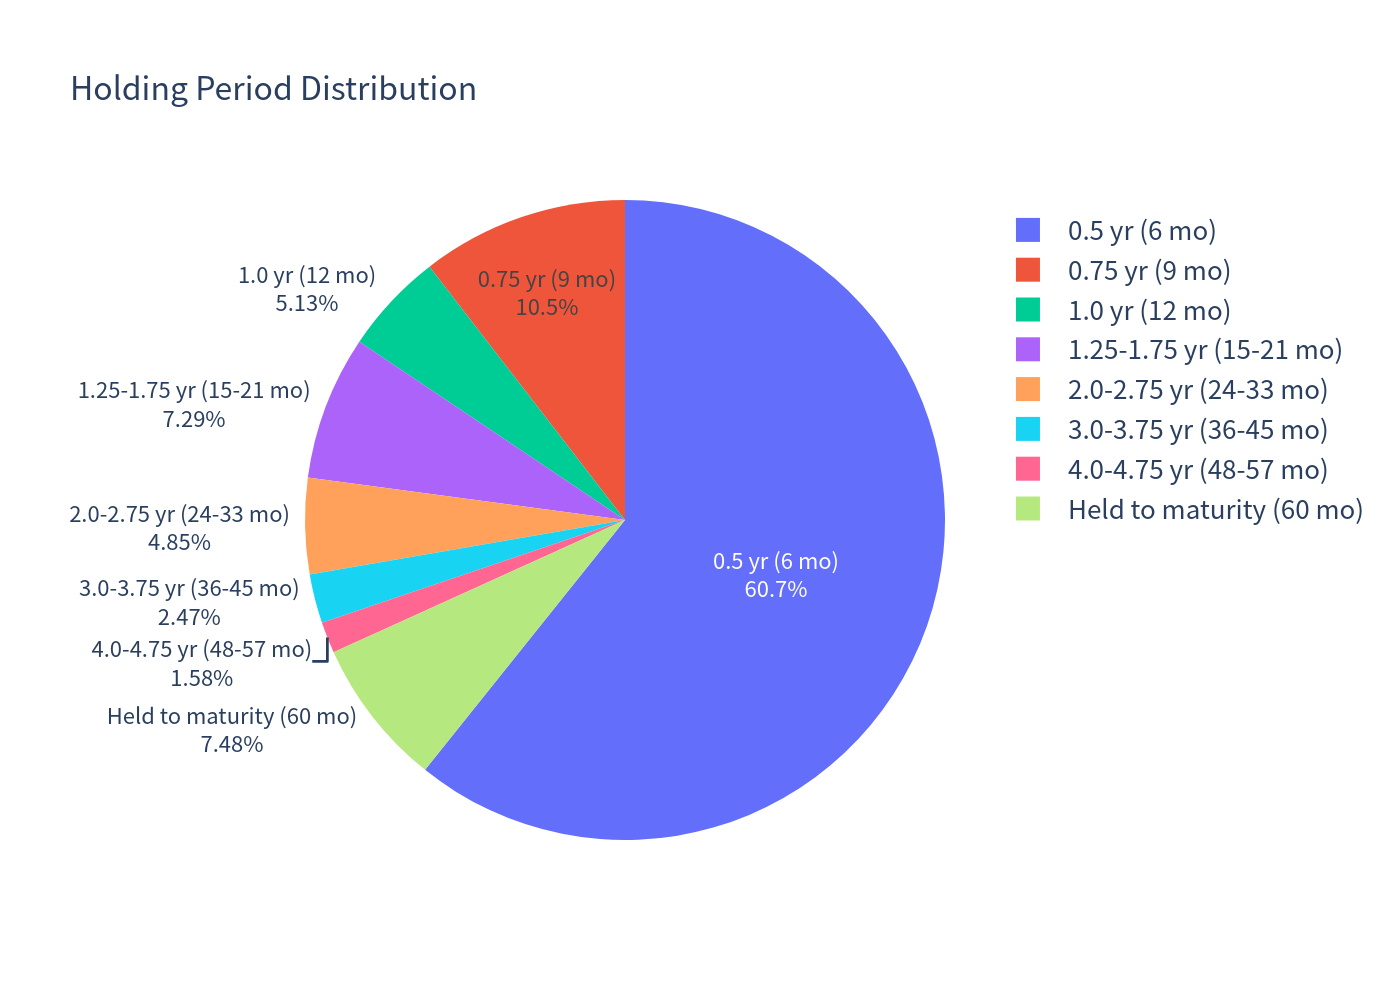
| Expected holding period | 1.17 years (14.1 months) |
| Expected total return over realized holding period | 11.85% |
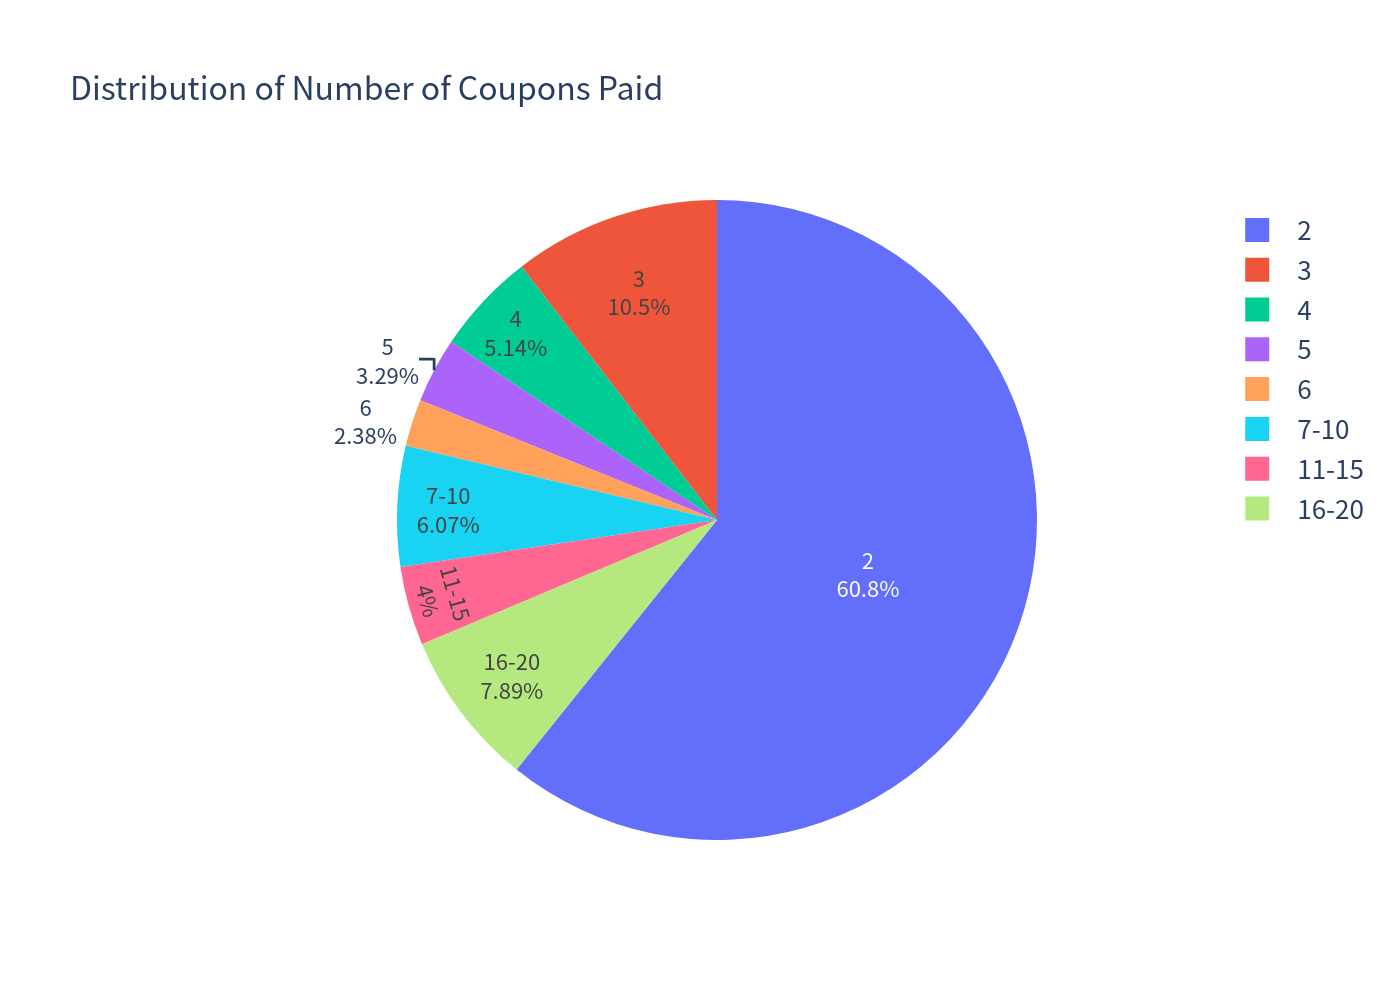
| Probability of early redemption (autocall) | 92.52% |
The securities are most likely to be automatically called early (about 92.5% of simulations, with the single most likely outcome being a call at the first redemption date, month 6). Because the note is redeemed for principal plus accrued coupon and does not participate in index upside, the return profile is a steady, low-volatility coupon stream rather than an equity-like exposure. The headline return (~10.6% annualized) is close to the 11.00% coupon rate, and losses occur only in the relatively rare paths that run all the way to maturity with the index below 50% of its starting level (the downside threshold).
2. Product Overview — How It Works (Plain English)
- Contingent coupon. The note pays a quarterly coupon equal to about 2.75% of principal (≈11.00% per year) — but only if the index closes at or above 50% of its starting level on the relevant quarterly observation date. If the index is below 50%, no coupon is paid for that period (there is no memory/accrual).
- Automatic early redemption (autocall). Starting at the first redemption determination date (month 6), if the index is at or above its starting level (100%), the note is redeemed early for principal plus that period's coupon, and nothing further is paid. This is why most simulations end early.
- Maturity (if never called). At maturity (5 years), if the index is at or above 50% of its starting level, you receive principal plus the final coupon. If the index is below 50%, you receive principal × (final level / initial level) — i.e., 1% of principal is lost for every 1% the index has fallen.
- Capped upside. You do not participate in any index appreciation. The best outcome is collecting the coupons and getting principal back.
Because the underlier is an explicitly "4% Decrement" index (a synthetic ~4% per year drag versus a total-return version), the index's expected appreciation is modest — this makes early calls and coupon payments more dependent on the index simply holding its level, and increases the importance of the 50% barrier over the full term.
3. Key Statistics — Structured Product vs Underlying
| Metric | Structured Product | Underlying (momentum index proxy, total return) |
|---|---|---|
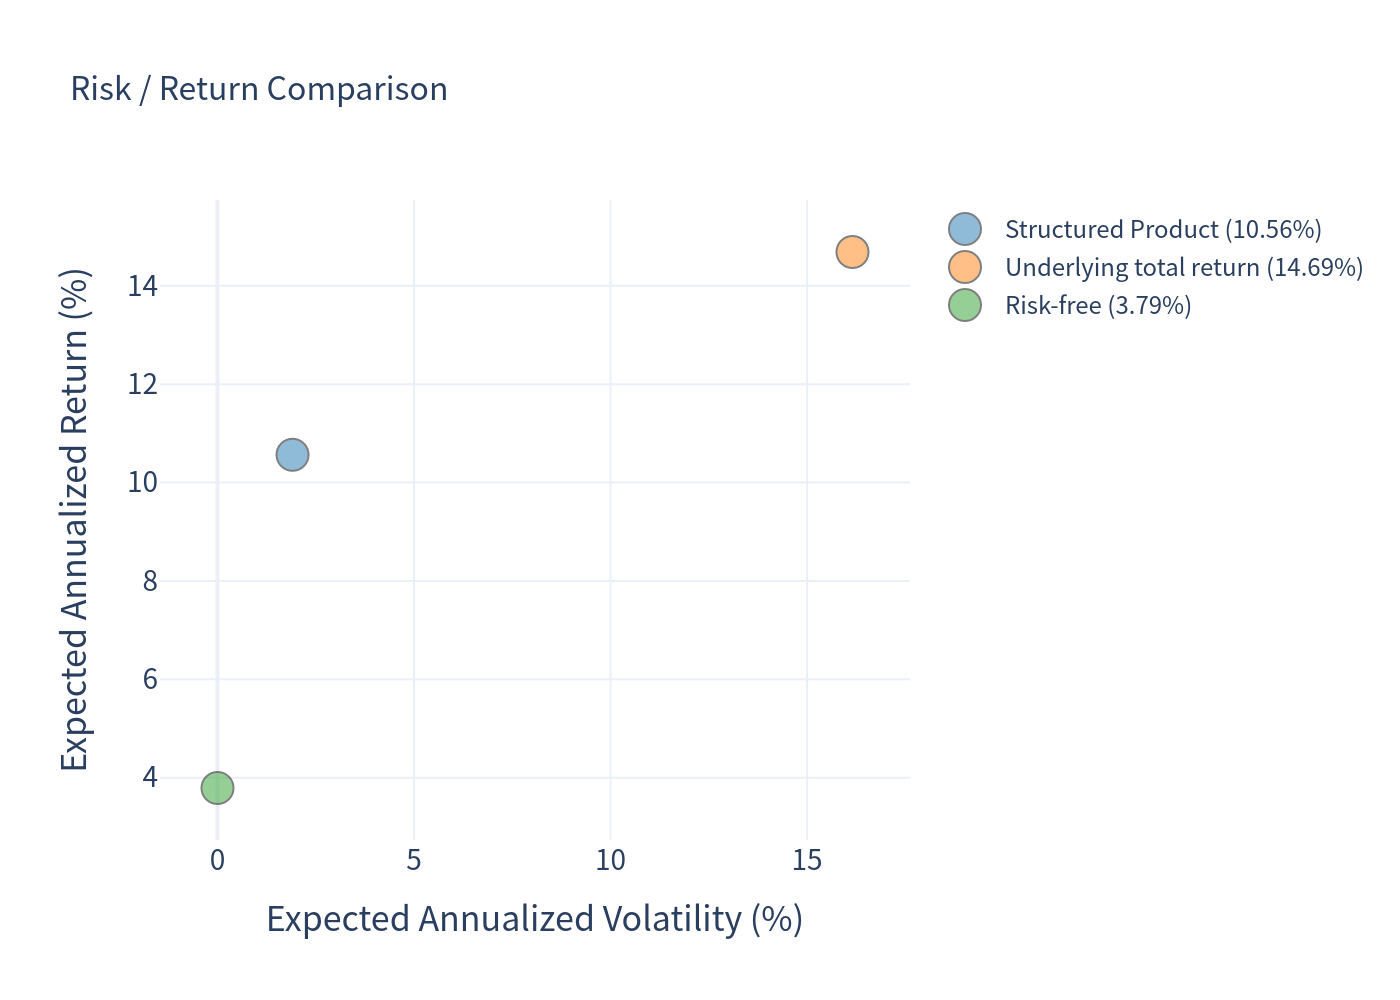
| Expected annualized return | 10.56% | 14.69% |
| Expected annualized volatility | 1.91% | 16.16% |
| Probability of loss | 1.16% | 7.16% |
| 99% confidence VaR (1-year) | -1.19% | -12.97% |
| Expected total return (realized holding period) | 11.85% | 6.07% |
| Average holding period | 1.17 years | 1.17 years |
Reading these numbers together. The product is called early in ~93% of paths, so it is frequently held for only 6–12 months. Annualizing the underlying's return over such short, favorable periods (called paths are up-moves by construction) inflates the underlying's mean annualized return. On a total-return basis over the same realized horizons the product actually delivers 11.85% versus 6.07% for holding the underlying, with far less risk. The product therefore trades away upside participation for a high-probability, cash-like return.
4. Charts
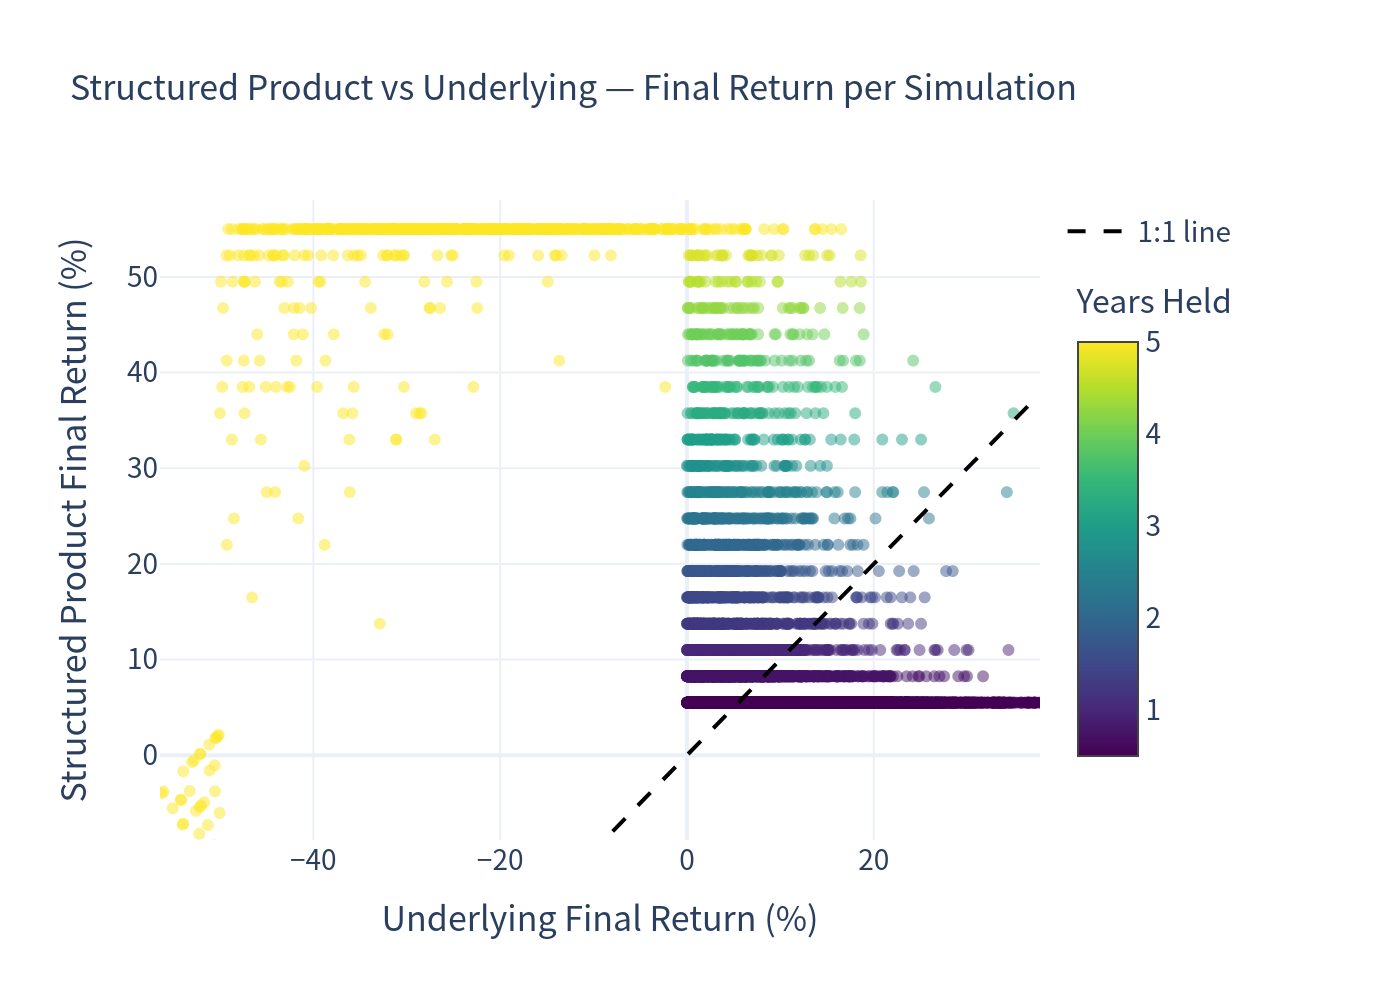
4.1 Final-Return Scatter (each simulation)
The scatter shows the classic autocallable signature: product returns are clustered around +5% to +11% (coupons), the upside is capped (a flat ceiling well below the 1:1 line on the right), while the downside tracks the index one-for-one on the left (the 1:1 line). Points are coloured by holding period.
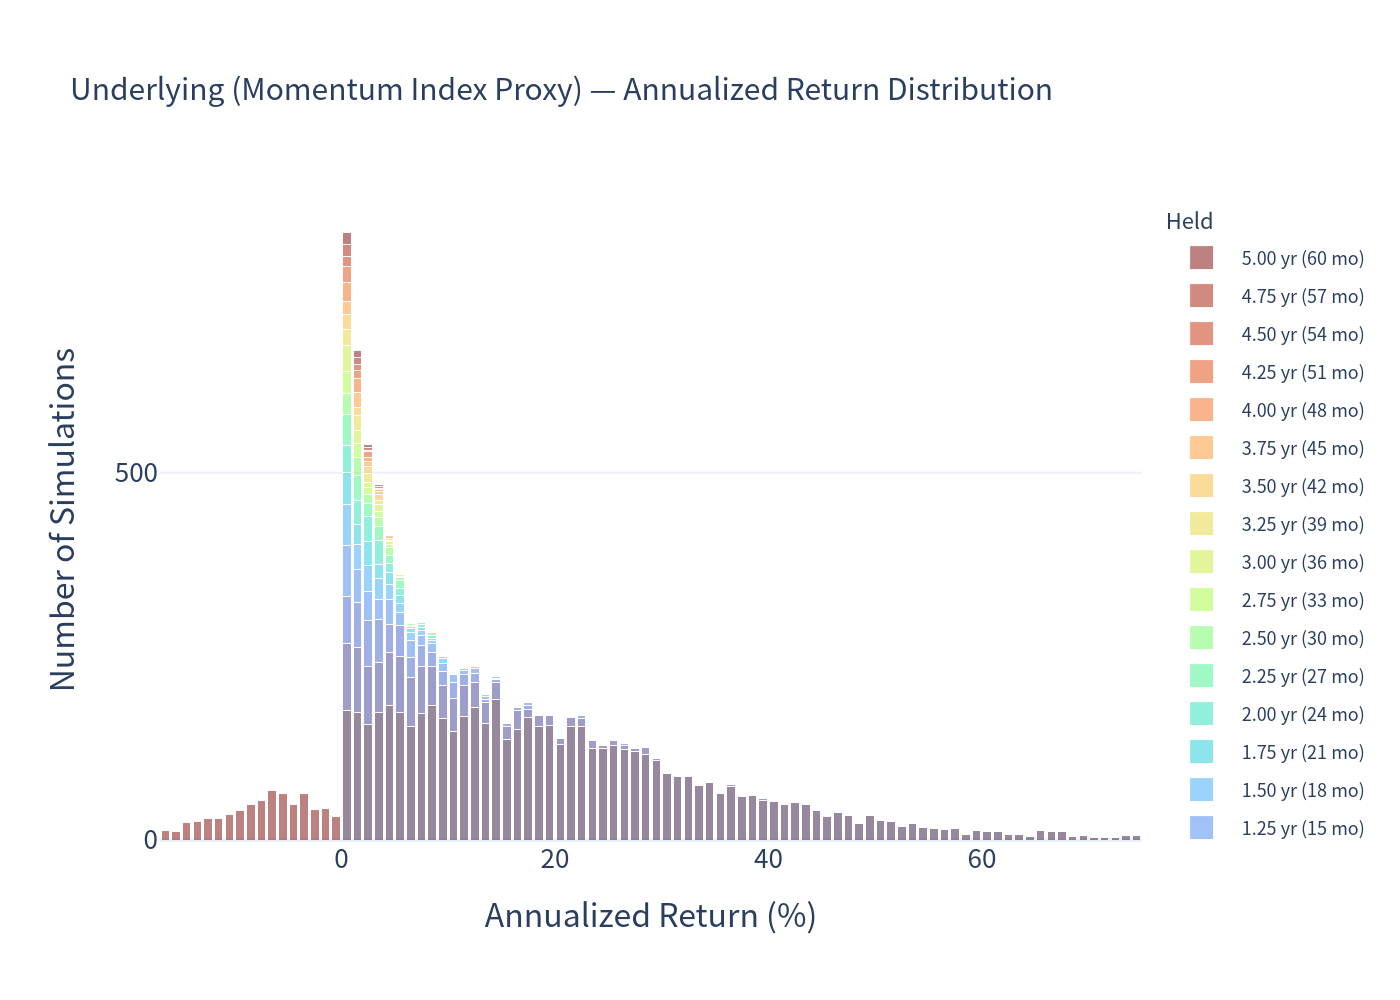
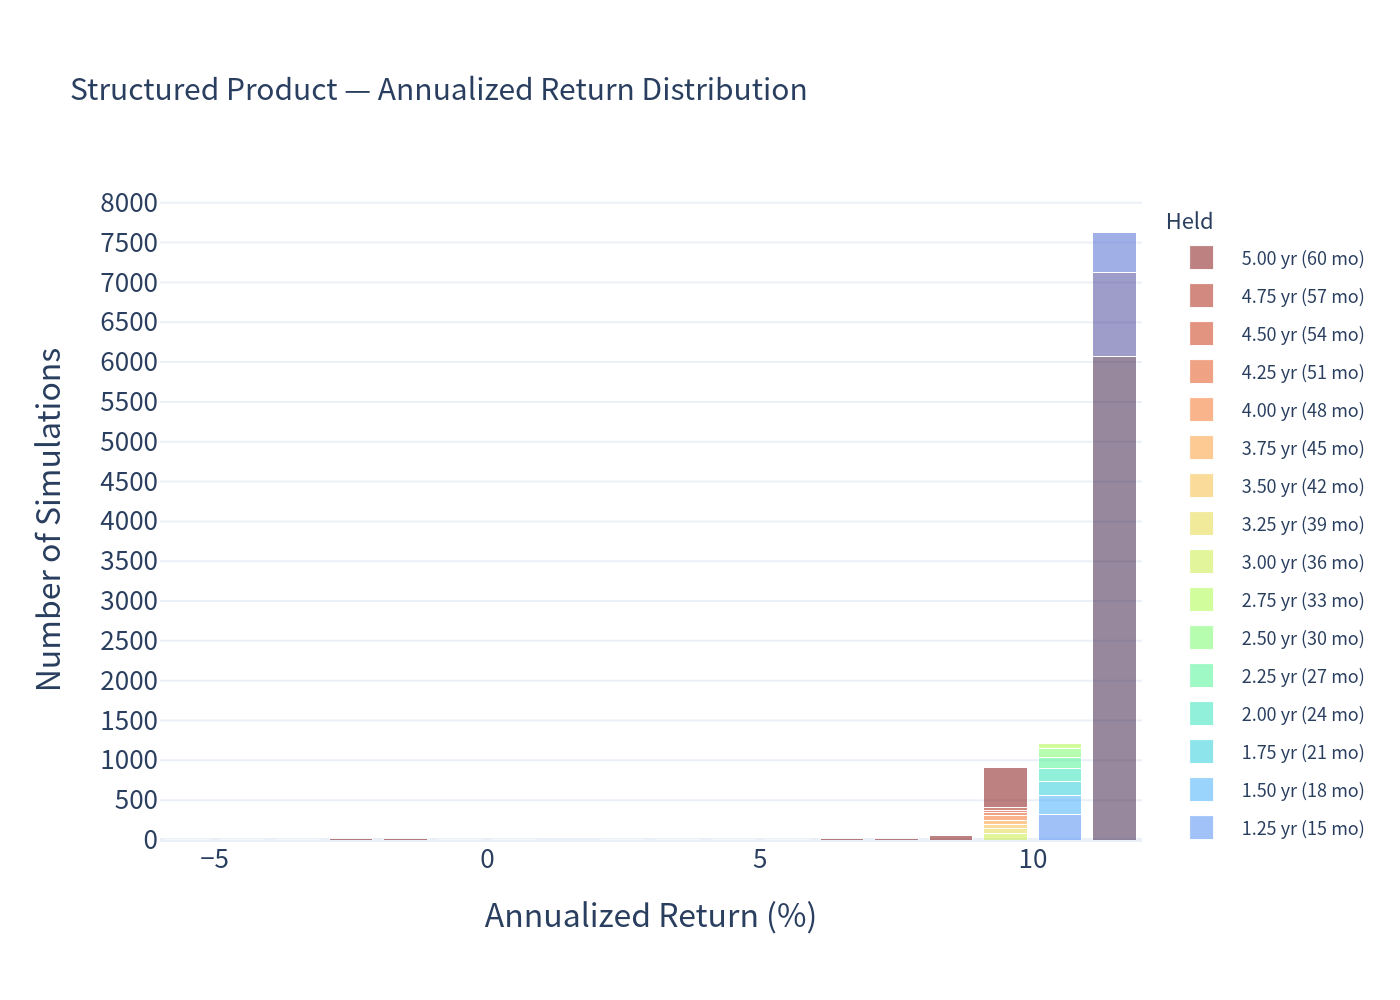
4.2 Simulated Annualized Return Distributions
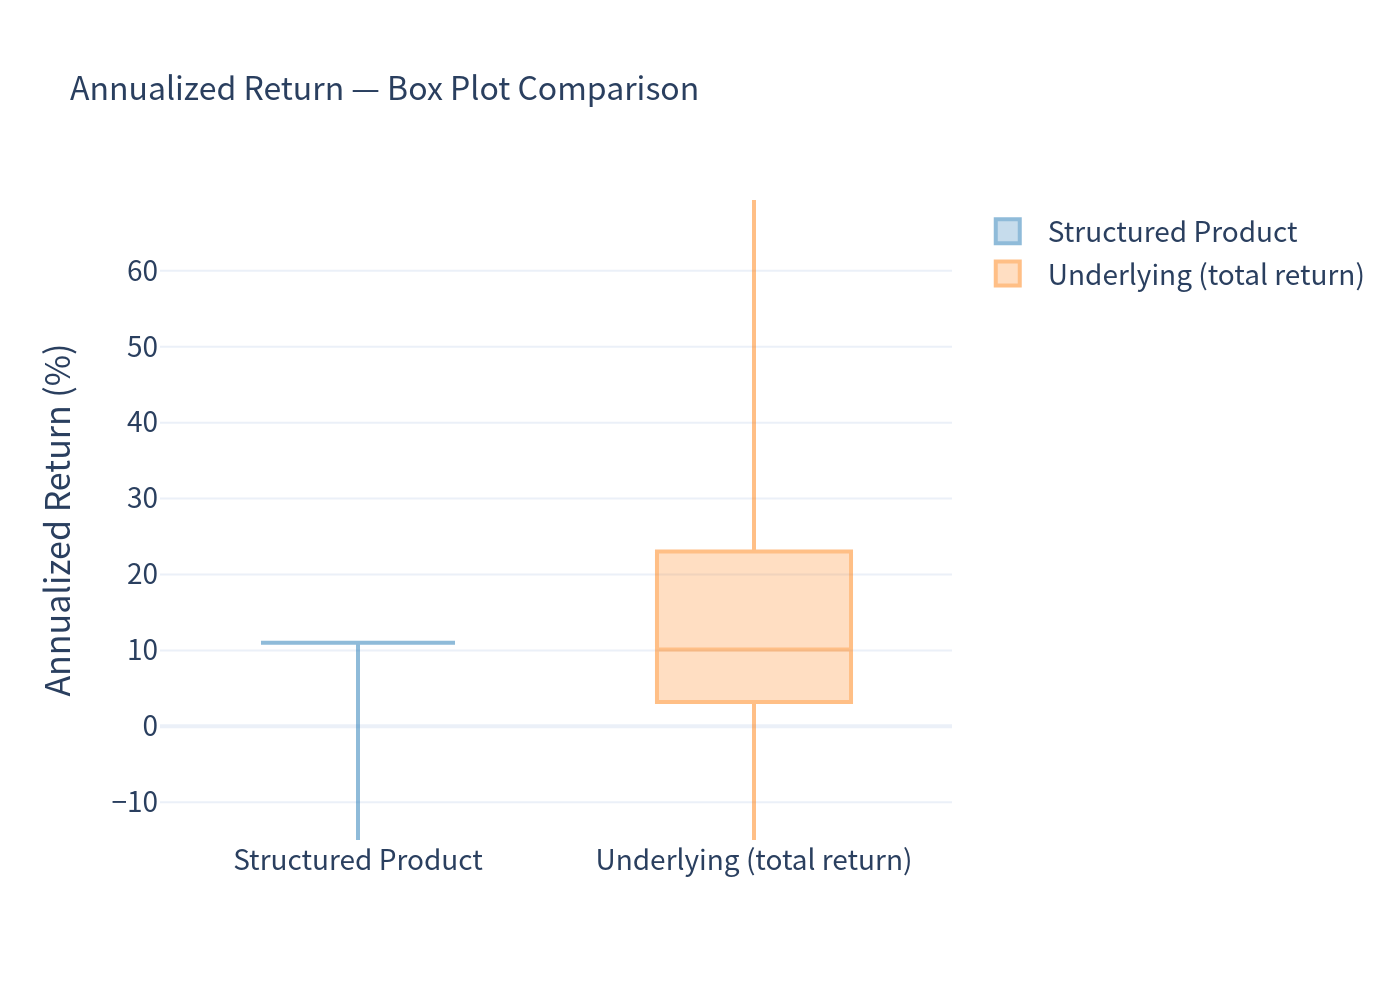
Underlying annualized returns (stacked by holding period) versus the tightly clustered product returns.
4.3 Scenario Probabilities
Chance of the worst case (negative total return), the best case (>10% annualized), and of beating cash.
4.4 Risk / Return Comparison
Product (low risk, moderate return), underlying total return (high risk, high return), and the risk-free rate.
4.5 Annualized Return — Box Plot
4.6 Holding Period and Coupon-Count Distribution
5. Investment Commentary
Potential merits
- Above-market running yield. An ~11% annual coupon is attractive versus comparable 5-year cash or Treasury rates (3.79%), and the note beats the risk-free rate in 98.75% of simulations.
- High probability of a positive outcome. The product avoids a loss in ~98.8% of simulations. The combination of a 50% barrier, quarterly coupons, and a frequent early call means most realistic paths return principal plus accumulated coupons.
- Low mark-to-market volatility. Because upside is capped and the coupon is fixed, the modelled return volatility (1.91%) is a small fraction of the underlying's (16.16%). The 99% 1-year VaR is only -1.19%.
- Short effective duration in a rising market. Early redemption lets capital be returned and redeployed, and each redeeming path still collects its coupon.
Key risks to be aware of
- Capped upside. Investors forgo any index appreciation; if the index rallies strongly the note is simply called at par plus a coupon, materially underperforming a direct holding.
- Reinvestment risk. With a ~92.5% early-redemption probability centred on the first few observations, the effective life may be short — the investor may need to replace the yield sooner than 5 years.
- Principal-at-risk tail. If the note runs full term with the index below 50% of its start, losses are leveraged one-for-one and can be severe. The worst simulated outcomes show principal losses (final product value can fall to roughly 15% of par in extreme paths before coupons).
- No coupon when the index is below 50%. Coupons are not accrued or remembered, so a deep drawdown period yields nothing.
- Credit risk. The securities are unsecured obligations of MSFL, guaranteed by Morgan Stanley; returns depend on the issuer's ability to pay.
This report presents model-based simulations and is for informational purposes only; it does not constitute investment advice or a suitability assessment.