
Morgan Stanley Jump Notes with Auto-Callable Feature — Simulation Report
Headline Simulation Results
| Metric | Value |
|---|---|
| Expected annualized return | 8.55% |
| Probability of negative return | 0.00% |
| 99% confidence VaR (1 year)* | 0.00% |
| Expected total return (over realized holding period) | 13.25% |
| Expected holding period | 23.58 months (~2.0 years) |
| Probability of outperforming risk-free rate (3.72%) | 91.73% |
Summary: The note is a principal-protected, auto-callable "Jump" structure. In the base-case simulation it delivers a 9.5% per annum payment when auto-called (which occurs in ~92% of scenarios), returns par if held to maturity with the index below its initial level (~7% of scenarios), and provides uncapped 100% upside participation if held to maturity with the index above its initial level.
VaR is computed on realized payoffs at the note's termination (auto-call or maturity), reflecting the principal-protection feature; it is not a mark-to-market 1-year market-risk measure.
Basic Product Information
How it works (layman's explanation)
- You invest $1,000 per note. The note is linked to a single strategy index: the S&P U.S. Equity Momentum 40% VT 4% Decrement Index — a U.S. equity momentum strategy targeting 40% volatility, with a 4% per-annum decrement (a fixed drag subtracted from the index return, similar to a dividend deduction).
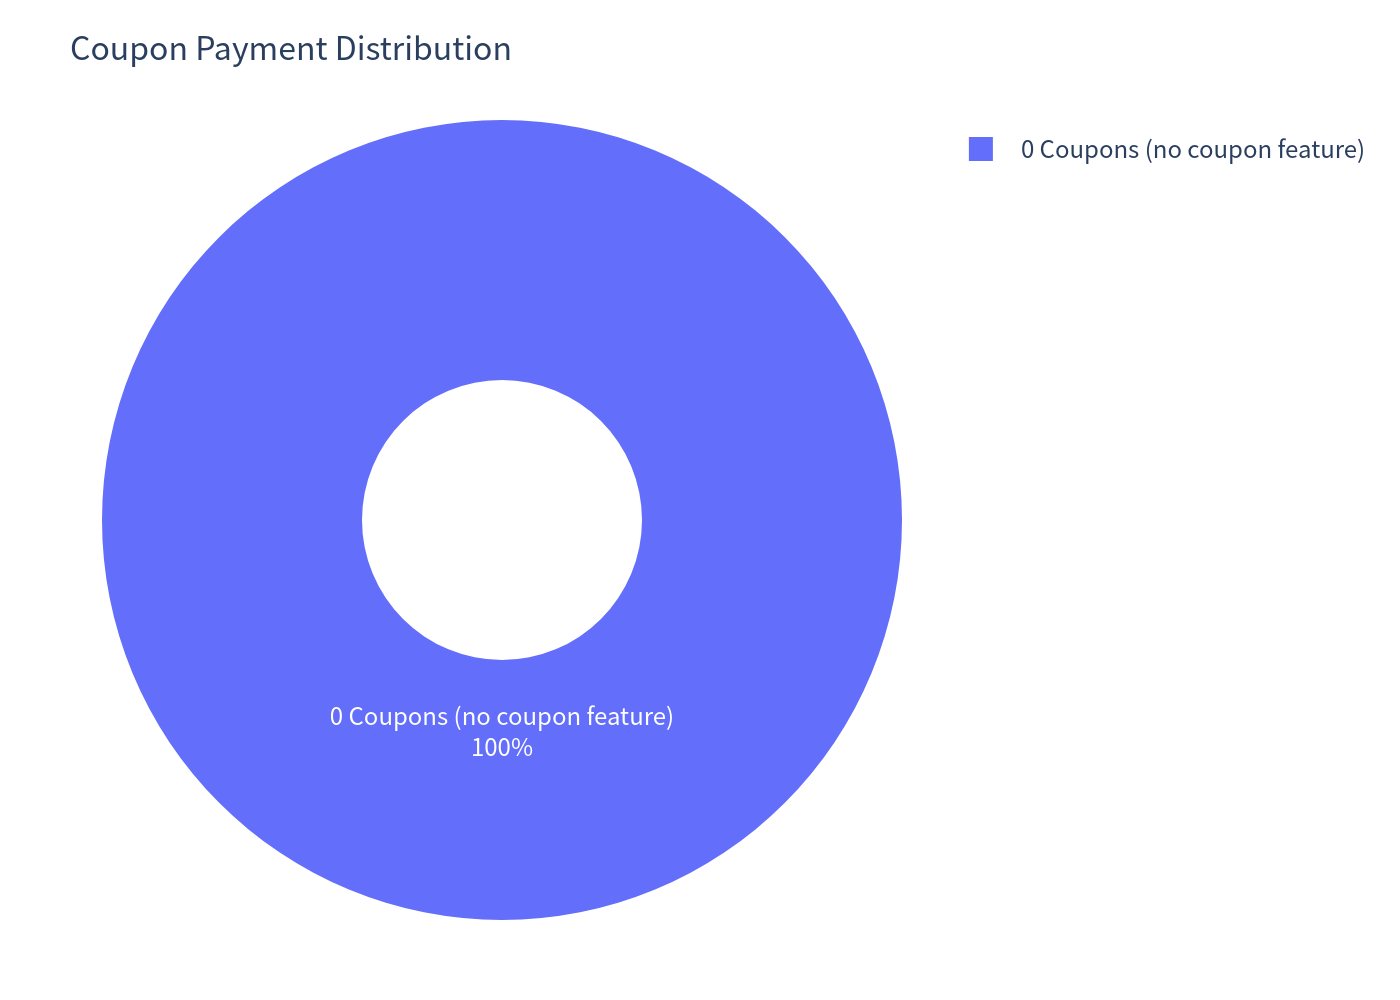
- The note pays no interest/coupon.
- Auto-call: On each annual determination date (years 1–6), if the index is at or above its initial level, the note is redeemed early for a payment that grows by ~9.5% per annum (e.g., $1,095 after 1 year, $1,190 after 2 years, ..., $1,570 after 6 years). No further payments follow.
- Maturity (if never auto-called — i.e., the index stayed below its initial level on all six annual determination dates):
- Index above initial level at maturity → you receive $1,000 + 100% of the index gain (contractually uncapped).
- Index at or below initial level → you receive $1,000 only.
- Principal protection: Under no circumstances is the maturity payment less than the stated principal amount.
Key statistics — structured product vs. underlying
| Statistic | Structured Product | Underlying (Decrement Index)* |
|---|---|---|
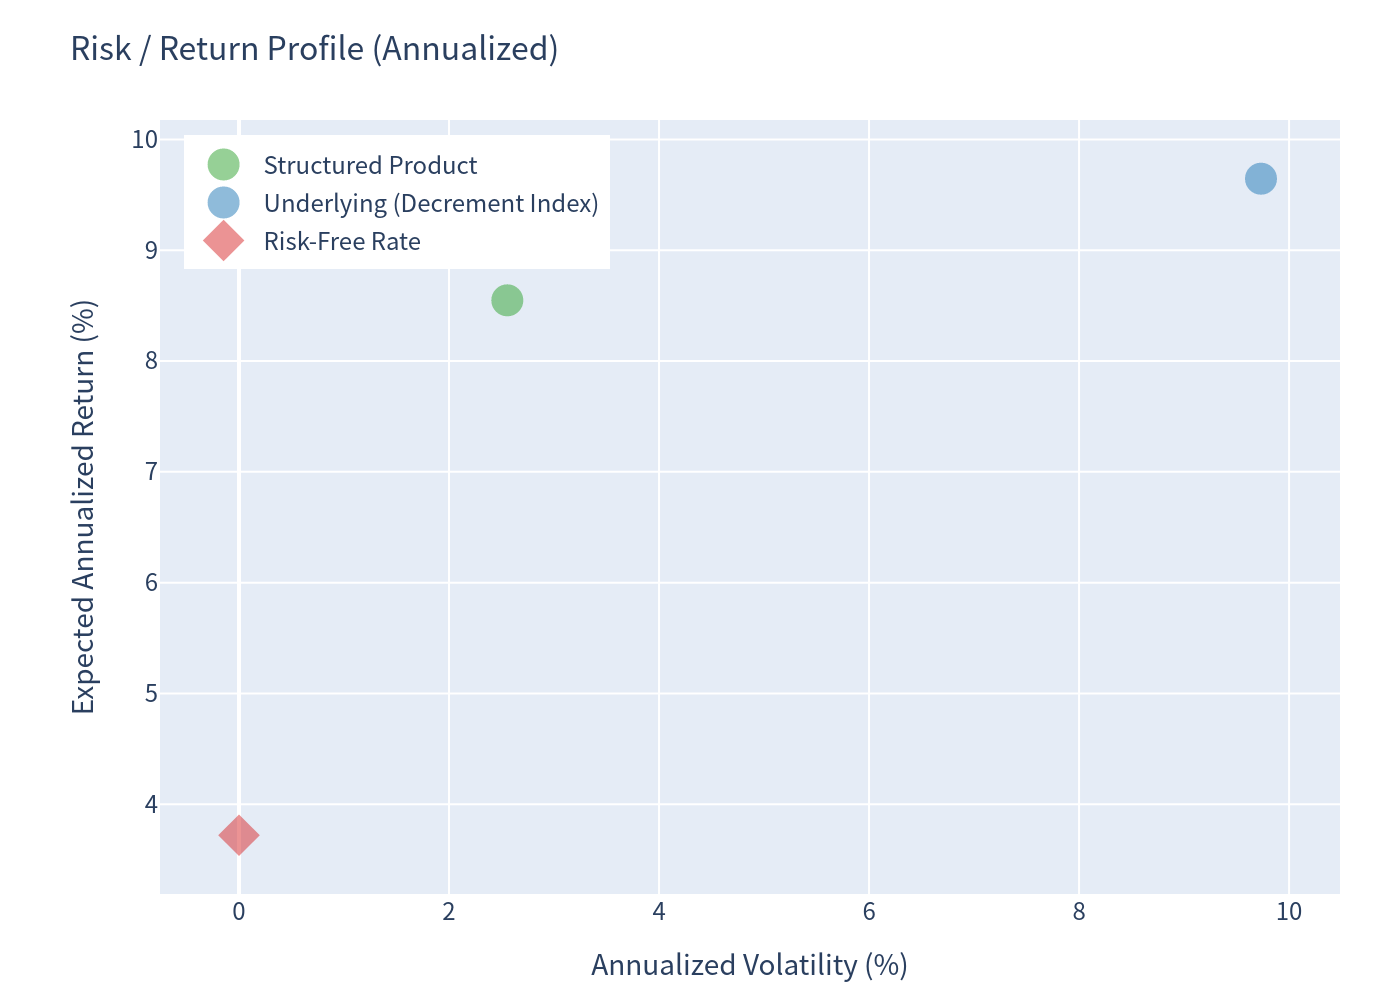
| Expected annualized return | 8.55% | 9.65% |
| Expected annualized volatility | 2.56% | 9.73% |
| Probability of loss | 0.00% | 7.24% |
| 99% VaR (1-year, annualized) | 0.00% | -9.86% |
| Expected total return (realized holding period) | 13.25% | 9.63% |
Underlying returns measured over the same holding period as each product simulation (i.e., the index level at the month the note terminated). Because auto-called paths require the index to be at/above its initial level, these underlying figures embed a favorable selection effect.
Reference context: The broad S&P 500 (with a ~1.01% dividend yield) is used only as a volatility/market proxy for the strategy index. The decrement index itself is a price index with the 4% decrement already embedded, so no additional dividend is added to its returns.
Simulation Outcome Charts
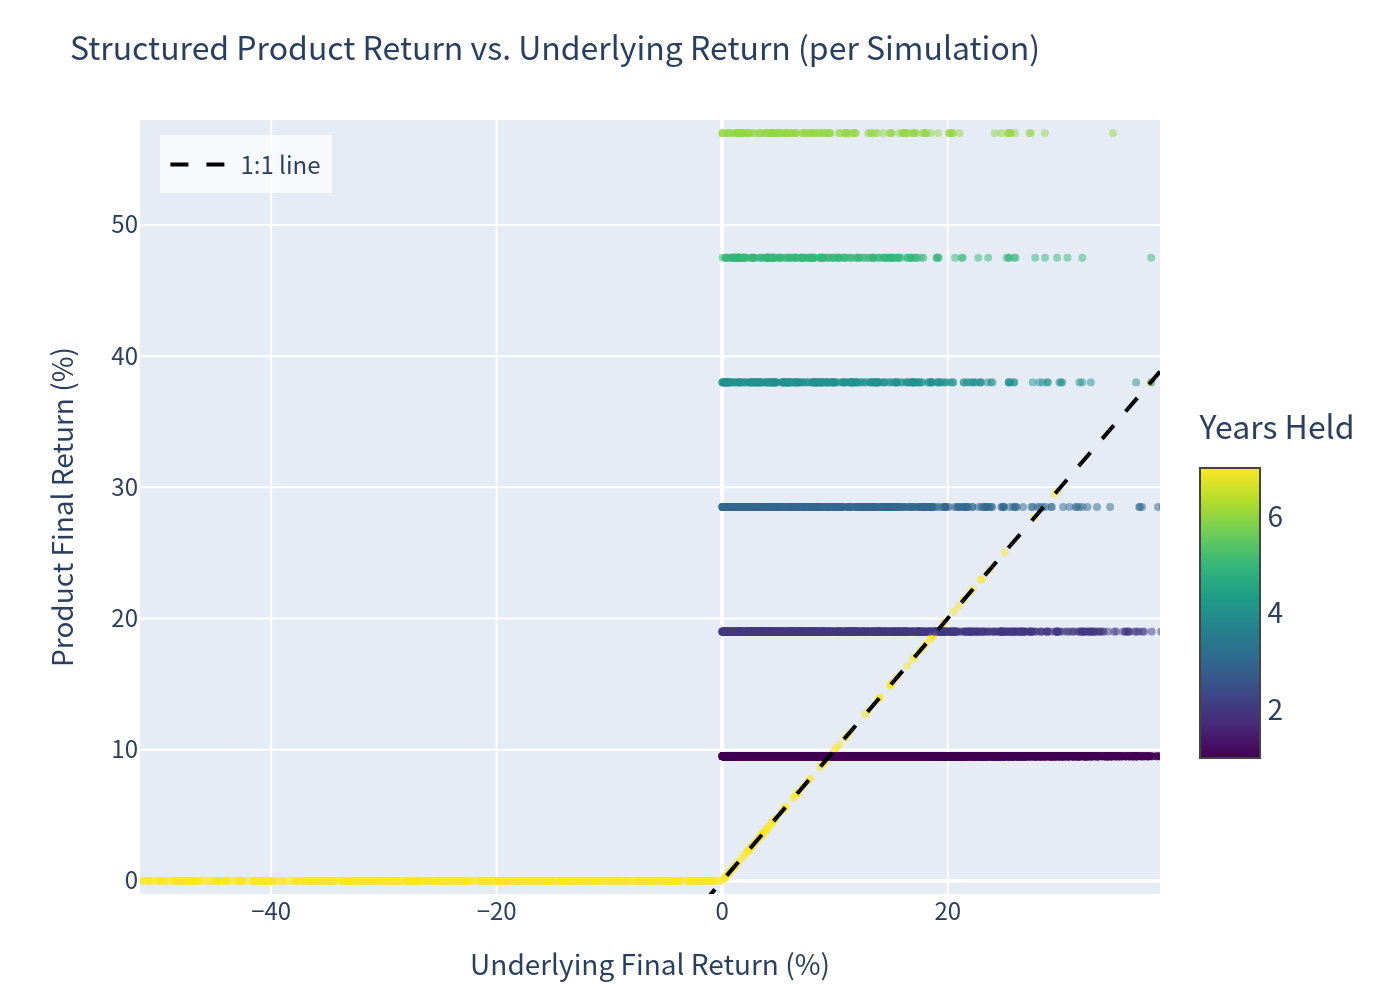
Scatter plot — product return vs. underlying return (per simulation)
Each dot is one simulation; color = number of years the note was held. The dashed 1:1 line shows the index return. Product returns cluster in discrete bands corresponding to the fixed early-redemption schedule (~9.5% p.a.), and the maturity tail sits near 0% (par), demonstrating the principal-protected profile with a contractually uncapped (but rarely reached) maturity upside.
Holding period distribution
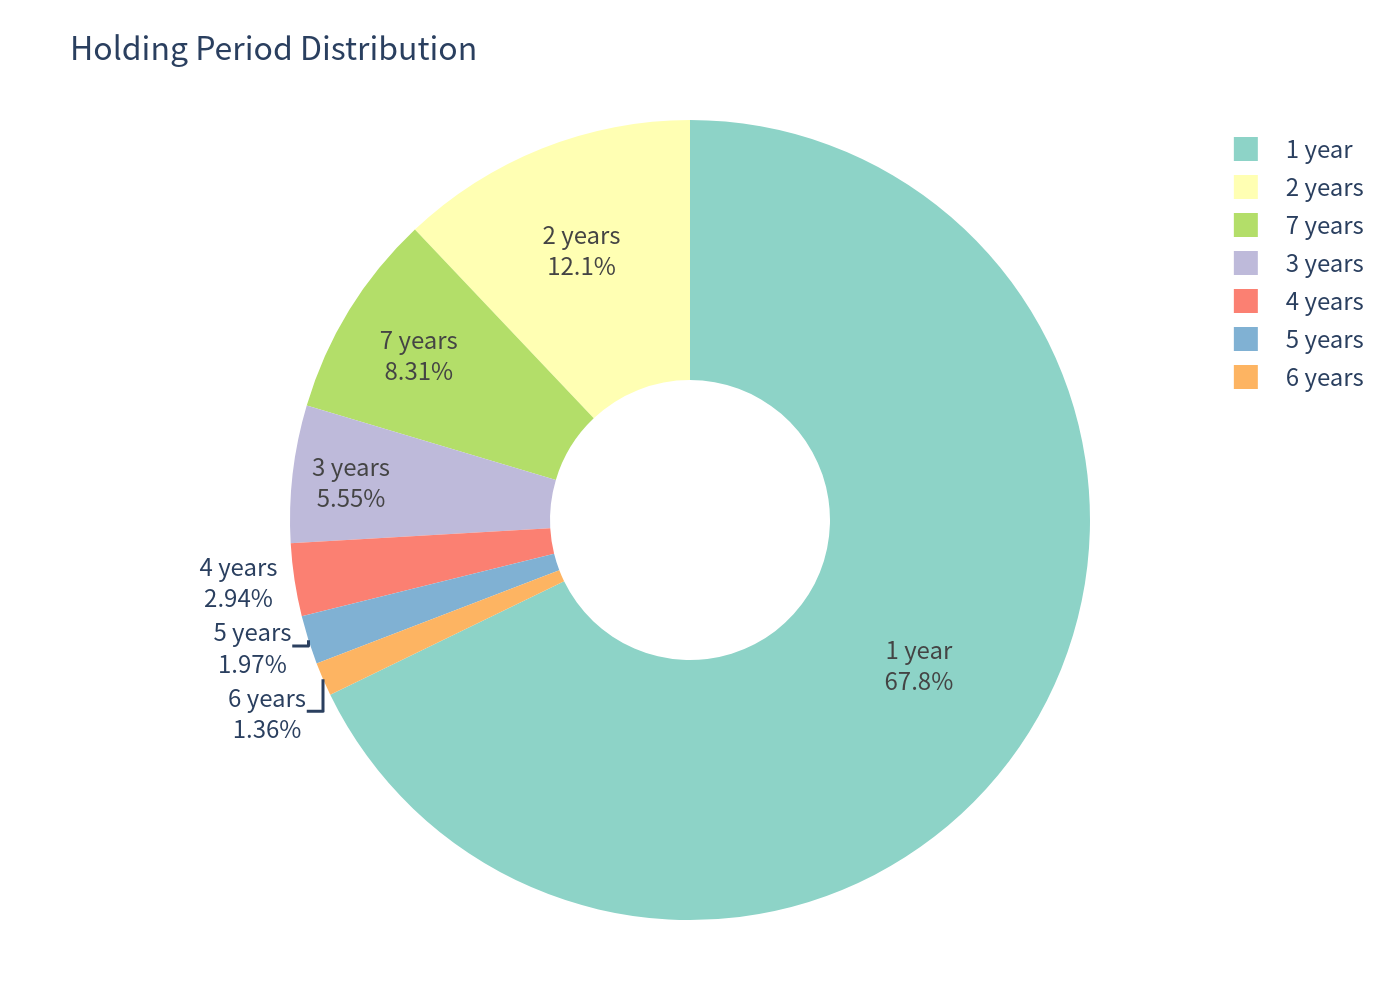
Distribution of the realized holding period across simulations (early redemption vs. maturity).
Annualized return histograms
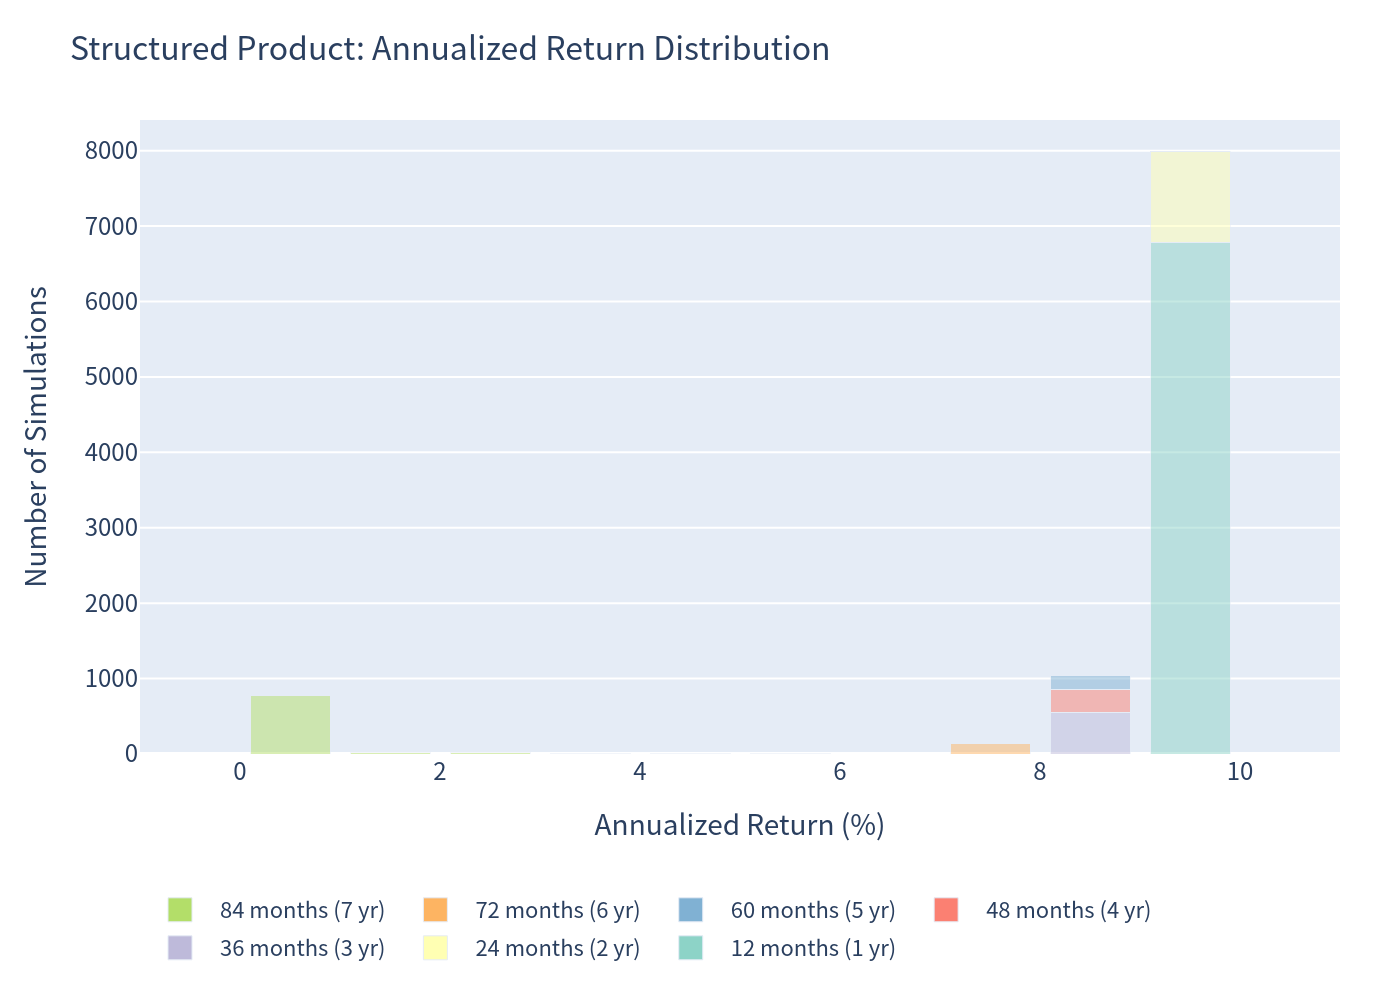
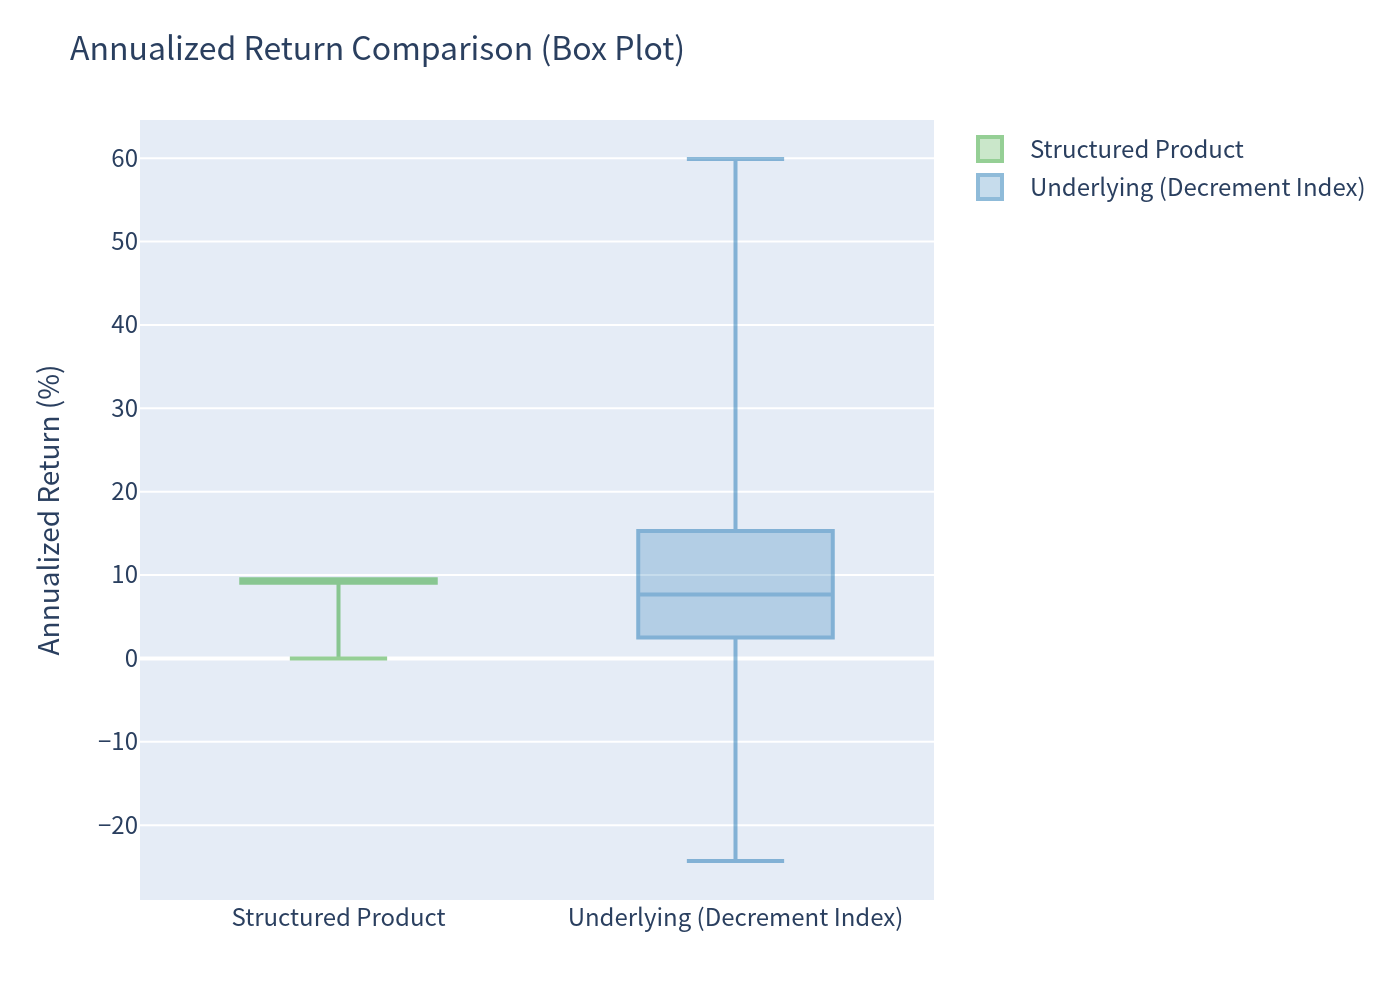
Distribution of annualized returns for the structured product (left) versus the underlying decrement index (right).
Underlying annualized return histogram
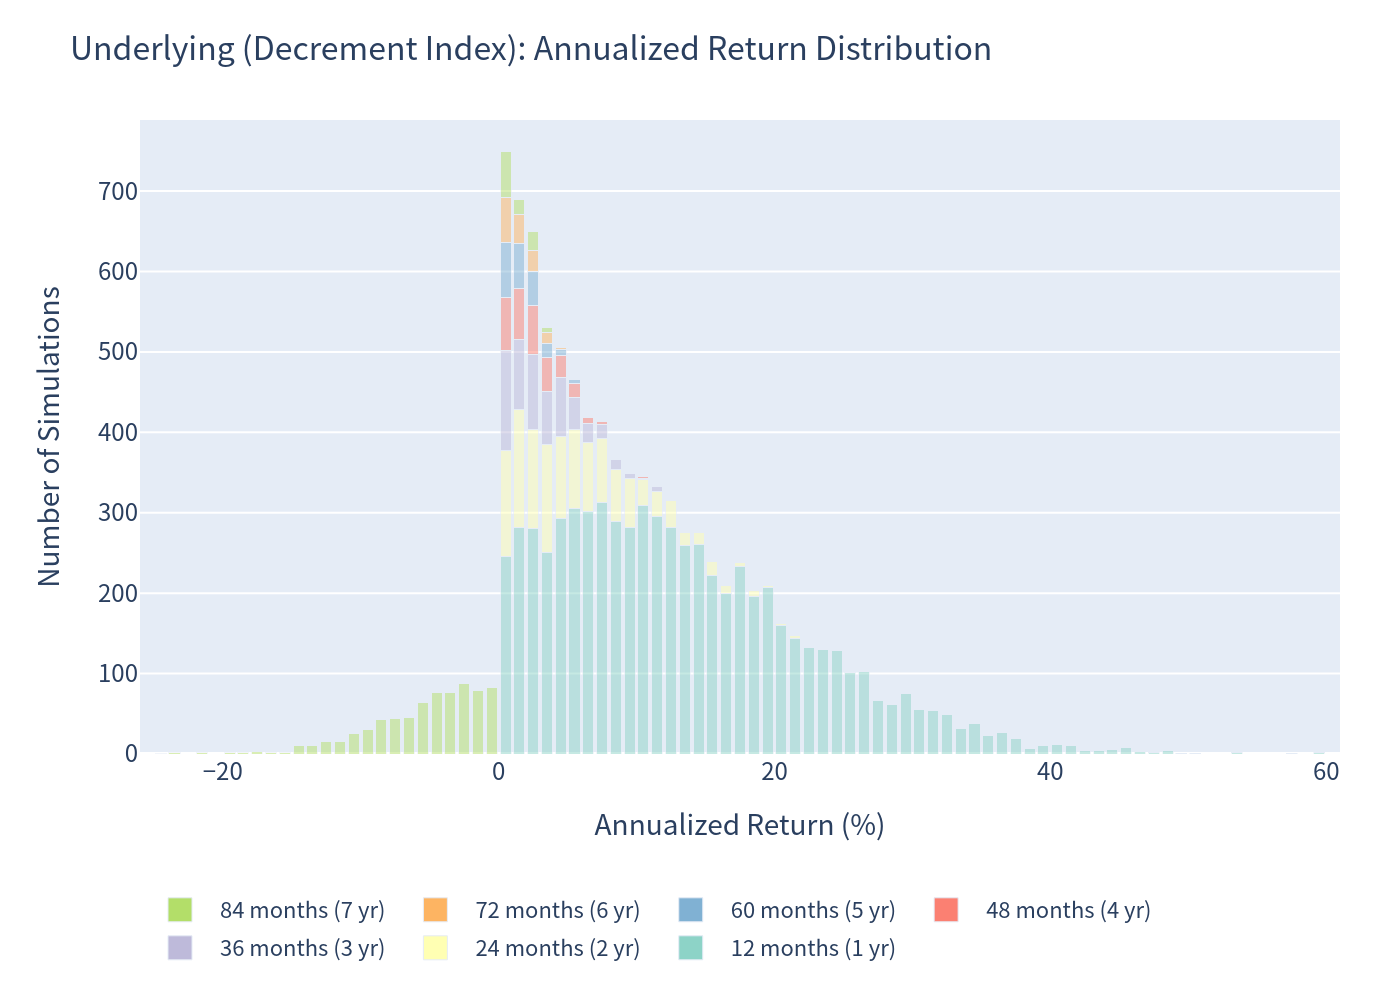
Distribution of annualized returns for the underlying decrement index over the same holding periods.
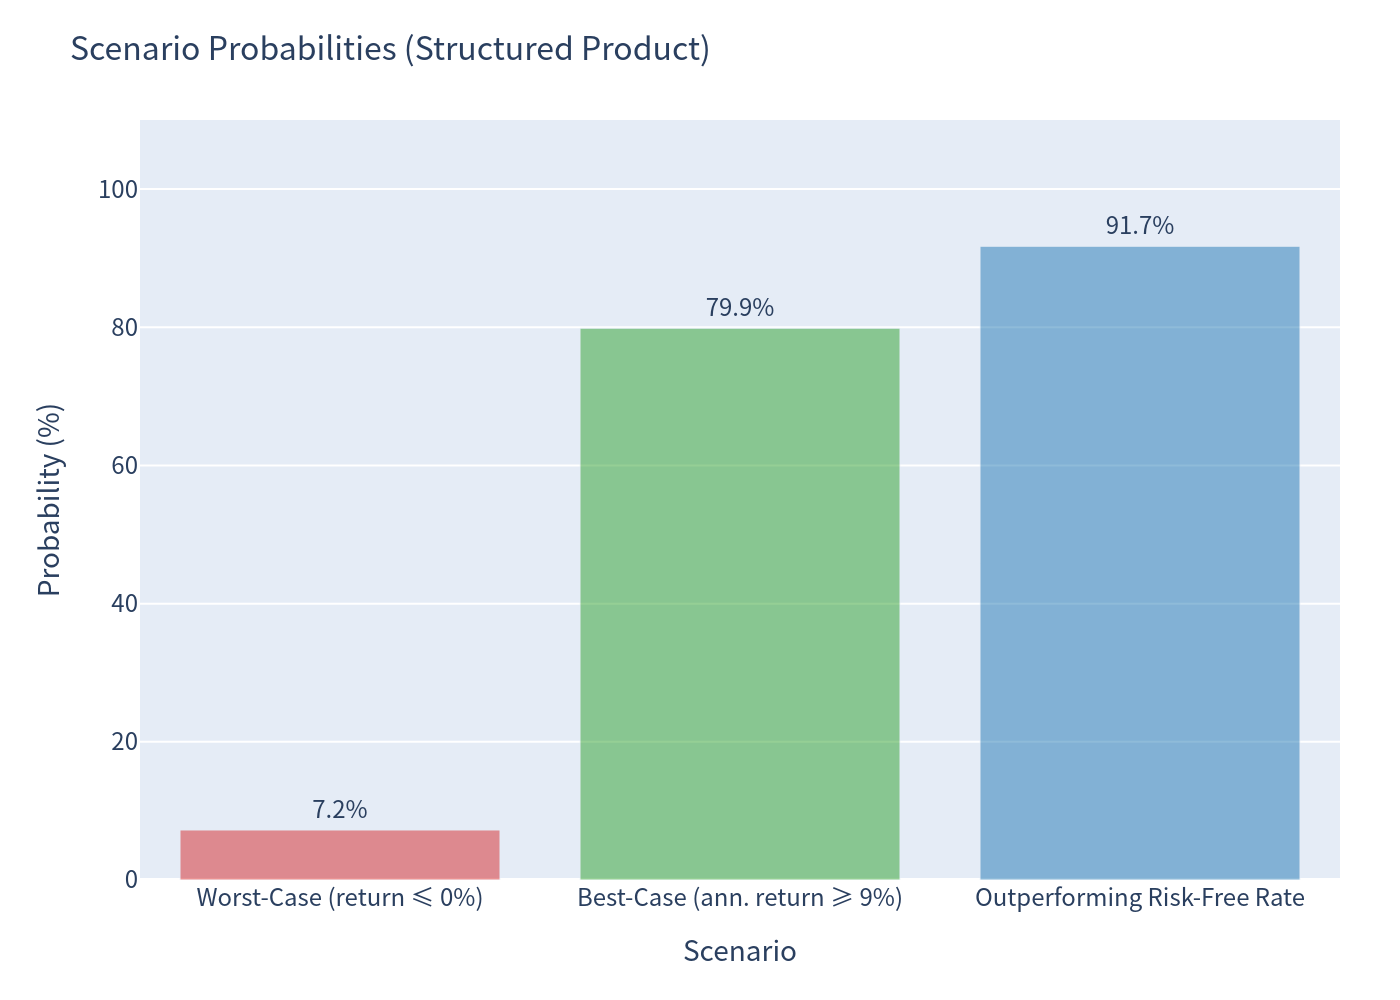
Scenario probabilities
Probability of each terminal scenario: auto-call at each annual determination date versus maturity outcomes.
Risk / return profile
Risk-return positioning of the structured product relative to the underlying index.
Annualized return box plot
Comparison of the distribution of annualized returns: structured product versus underlying index.
Redemption payment structure
The note pays no coupons (zero-coupon structure); payments consist solely of the early-redemption or maturity redemption amounts.
Investment Commentary
What the simulation shows
- High hit-rate of early redemption: ~92% of scenarios trigger the auto-call, with 67.8% redeeming after just 1 year at a 9.5% annualized return, and ~80% achieving an annualized return of at least 9%.
- Downside protection is real: the note never loses principal in the simulation (0% probability of loss); the worst case is a 0% total return (7.24% of scenarios) — i.e., you get your $1,000 back after 7 years with no growth.
- Returns are dominated by the fixed early-redemption schedule (~9.5% p.a.). The uncapped maturity upside is rarely reached: to reach maturity the index must stay below its initial level on all six annual determination dates and then finish above it at year 7 — only ~1% of scenarios produce meaningful maturity upside.
- Expected total return of 13.25% should be read together with the short expected holding period (~2 years): most capital is returned quickly at 9.5–19% cumulative gains.
Strengths
- Zero probability of loss at maturity (principal protected by the issuer).
- Attractive expected annualized return (8.55%) versus the risk-free rate (3.72%), with 91.7% of scenarios beating cash.
- Very low return volatility (2.56% annualized) relative to the underlying index.
- Full (contractually uncapped) upside participation if the index finishes above its initial level at maturity.
Considerations
- Annualized returns are effectively determined by the ~9.5% per-annum auto-call schedule in most scenarios; very high index returns do not translate into outsized note returns unless the note survives to maturity with the index above its initial level.
- In ~7% of scenarios the note simply returns principal after 7 years — a zero total return that underperforms cash over the full term.
- The return is subject to Morgan Stanley credit risk; the note is an unsecured obligation.
- The underlier is a strategy index with a 4% annual decrement, so the index must outperform by more than 4% p.a. before the investor sees any index-driven gain.
- Modeling assumptions: the underlier was proxied by S&P 500 volatility (GJR-GARCH) with a 4% annual decrement applied to the drift; the 40% volatility-targeting overlay is not explicitly modeled, and the call threshold is assumed at 100% of the initial level per the term sheet's hypothetical examples. Actual index volatility is targeted near 40%, which could increase the frequency of extreme outcomes relative to this simulation.