Structured Product Analysis Report
10.80% p.a. Multi Barrier Reverse Convertible on Lonza, Sandoz, Straumann
Headline Results
Product Overview
This is a Multi Barrier Reverse Convertible on three Swiss equities: Lonza Group AG, Sandoz Group AG, and Straumann Holding AG. It offers a fixed quarterly coupon of 2.70% (10.80% p.a.) regardless of underlying performance, combined with conditional downside protection.
How It Works
- Coupon Payments: The investor receives a fixed coupon of CHF 27.00 per CHF 1,000 Denomination every quarter (6 payments in total if held to maturity).
- Issuer Callable: The Issuer has the right to call (early redeem) the product on quarterly observation dates (months 6, 9, 12, 15) if it is advantageous. When called, the investor receives the full Denomination plus the coupon for that period.
- Barrier Protection: A Barrier Event occurs if any of the three underlyings trades at or below 59% of its initial level at any time during the product's life.
- Maturity Redemption (if not called early):
- No Barrier Event: Full Denomination (100%) returned.
- Barrier Event occurred + Worst performer ≥ Strike: Full Denomination returned.
- Barrier Event occurred + Worst performer < Strike: Physical delivery of the worst-performing underlying (value = its final price).
The product runs for 18 months (May 2026 – November 2027).
Key Statistics Comparison
| Metric | Structured Product | Benchmark (SSMI + Dividends) |
|---|---|---|
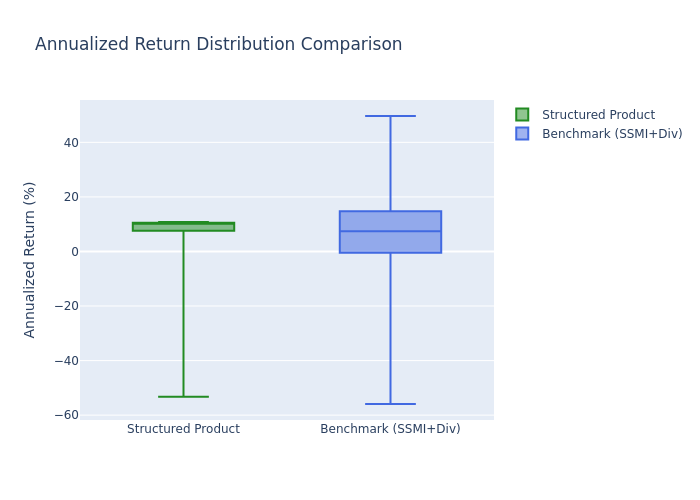
| Expected Annualized Return | 3.99% | 7.15% |
| Expected Annualized Volatility | 12.15% | 11.51% |
| Probability of Loss | 18.93% | 30.28% |
| 99% Confidence VaR (1 Year) | -33.19% | -20.41% |
Distribution of Outcomes
Charts
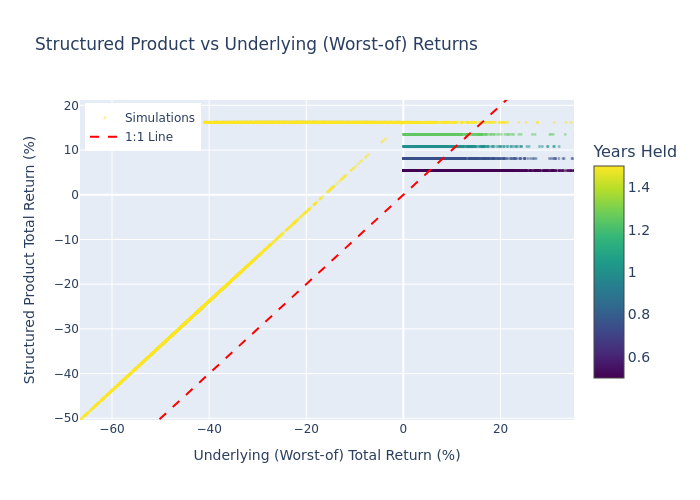
Simulation Outcome Scatter
Each point represents one simulation. The 1:1 line shows where product returns equal underlying returns. Points above the line indicate the product outperformed the worst-of underlying.
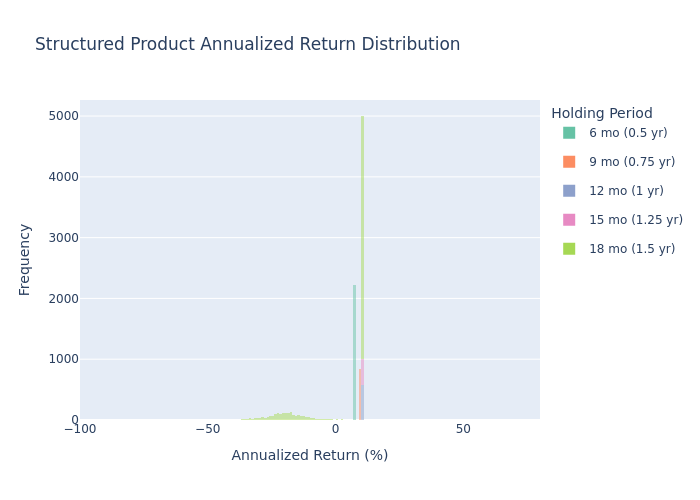
Return Distributions
Structured Product annualized return distribution, stacked by holding period.
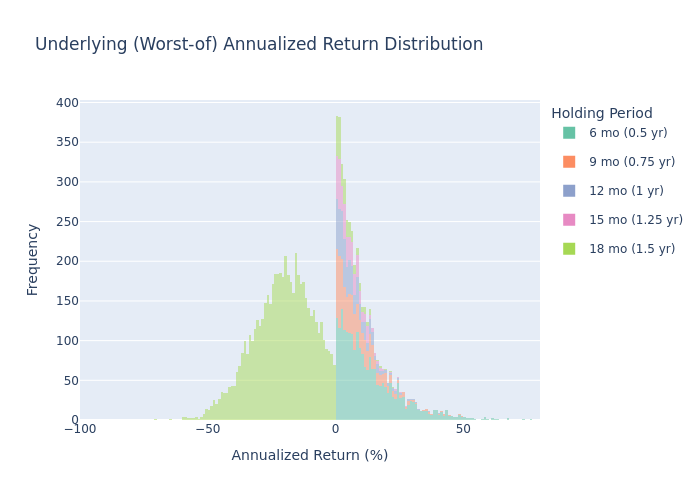
Underlying Return Distribution
Underlying (Worst-of) annualized return distribution, stacked by holding period.
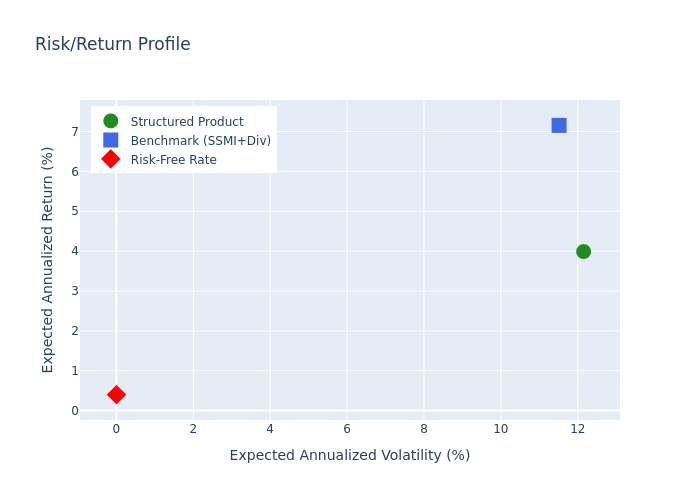
Risk/Return Profile
Risk-return comparison between the structured product, the benchmark (SSMI + dividends), and the risk-free rate.
Box Plot Comparison
Annualized return distribution comparison.
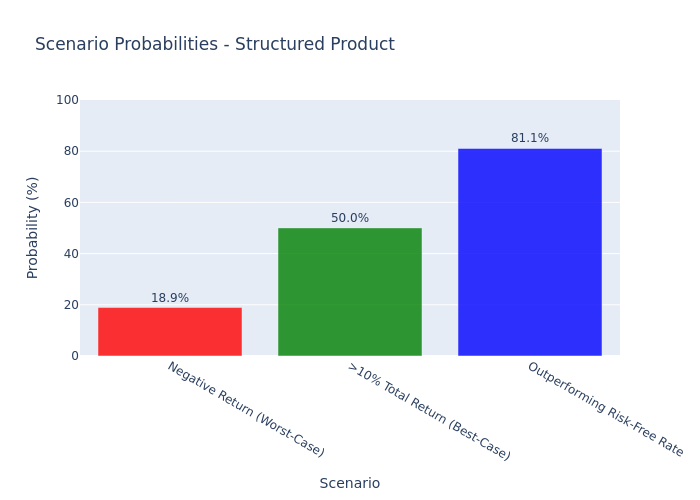
Scenario Probabilities
Probabilities of key scenarios for the structured product.
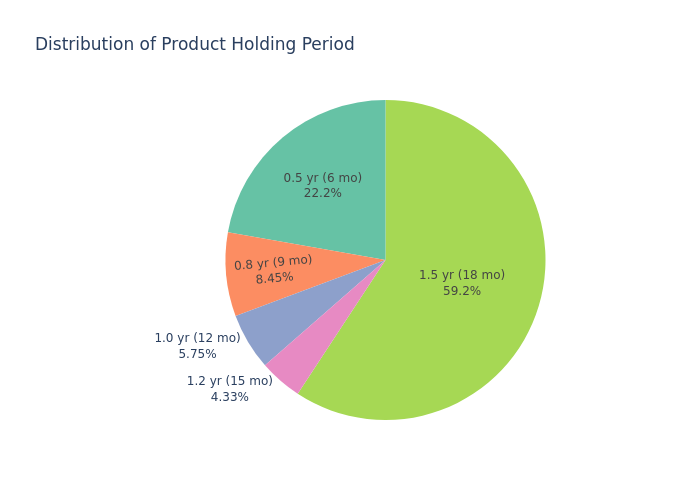
Holding Period Distribution
Distribution of how long the product was held (pie chart).
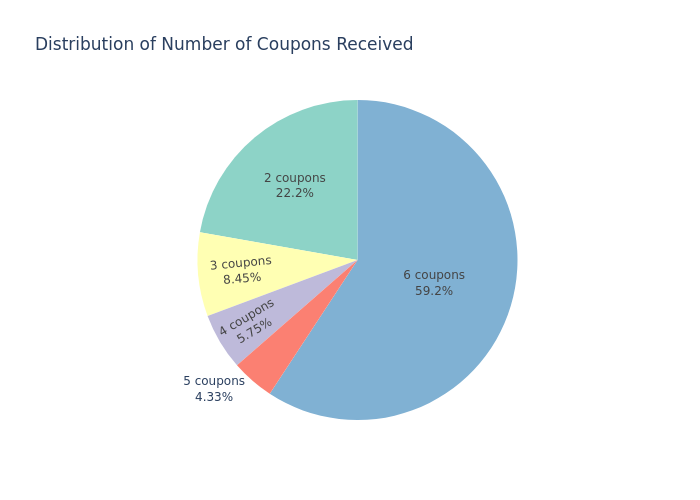
Coupon Count Distribution
Distribution of number of coupons received (pie chart).
Investment Commentary
Key Strengths
Key Risks
This report is for informational purposes only and does not constitute investment advice. Past performance and simulations are not indicative of future results.