
Structured Product Analysis Report
34.60% p.a. Multi Barrier Reverse Convertible on Apple & Nebius
Headline Simulation Results
Basic Product Information
How It Works
This is a Multi Barrier Reverse Convertible linked to the worst-performing of two US-listed stocks: Apple Inc. (AAPL) and Nebius Group NV (NBIS). The product offers a very high fixed coupon of 34.60% p.a. (paid quarterly, USD 86.50 per USD 1,000 denomination) regardless of how the underlying stocks perform.
Key Mechanisms
- Coupon Payments: The investor receives quarterly coupons of USD 86.50 per USD 1,000 invested, regardless of underlying stock performance.
- Callable by Issuer: The issuer (Leonteq) has the right to redeem the product early on specific observation dates (every 3 months starting from month 6). If called, the investor receives par (USD 1,000) plus the coupon for that period. The issuer is assumed to call when both underlyings are performing well (above their initial levels), as this allows them to refinance at lower cost.
- Barrier Protection: A "Barrier Event" occurs if at any time during the 15-month observation period, either AAPL or NBIS trades at or below 49% of its initial level (a 51% decline).
- Maturity Redemption:
- No Barrier Event: Investor receives full par value (USD 1,000).
- Barrier Event Occurred + Worst Performer ≥ 100%: Investor receives full par value.
- Barrier Event Occurred + Worst Performer < 100%: Investor receives physical shares of the worst-performing stock, with a value equal to the stock's final price (a loss proportional to the stock's decline).
Key Statistics
| Structured Product vs Underlying (Worst Performer of AAPL & NBIS) | Structured Product | Underlying (with dividends) |
|---|---|---|
| Expected Annualized Return | 31.98% | 0.60% |
| Expected Annualized Volatility | 8.99% | 27.73% |
| Probability of Loss | 4.19% | 45.64% |
| 99% VaR (1 Year) | -12.19% | -50.11% |
| Expected Total Return | 29.84% | -6.26% |
| Holding Period & Coupon Statistics | Value |
|---|---|
| Expected Holding Period | 11.2 months |
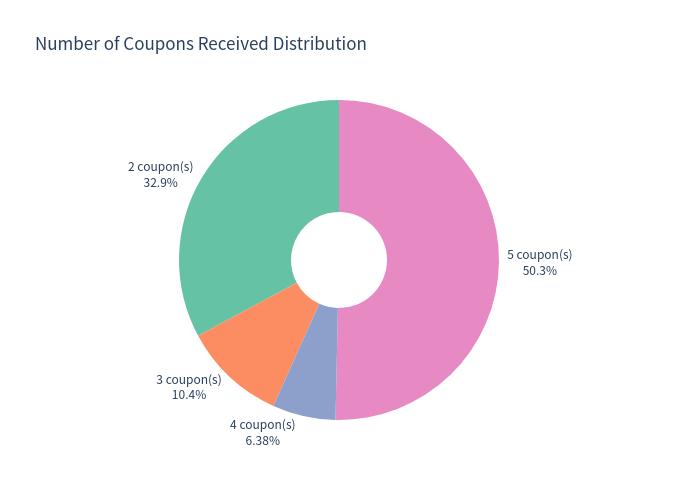
| Expected Number of Coupons Received | 3.7 (out of max 5) |
| Barrier Event Probability | 4.95% |
| Early Redemption Probability | ~49.7% (called in months 6-12) |
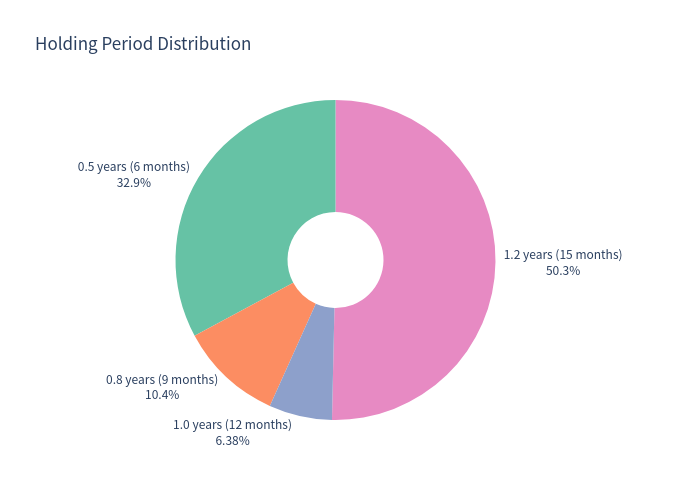
The product is called early in approximately 49.7% of simulations (when both underlyings perform well), and held to maturity in 50.3% of cases.
Charts
Simulation Outcome Scatter Plot
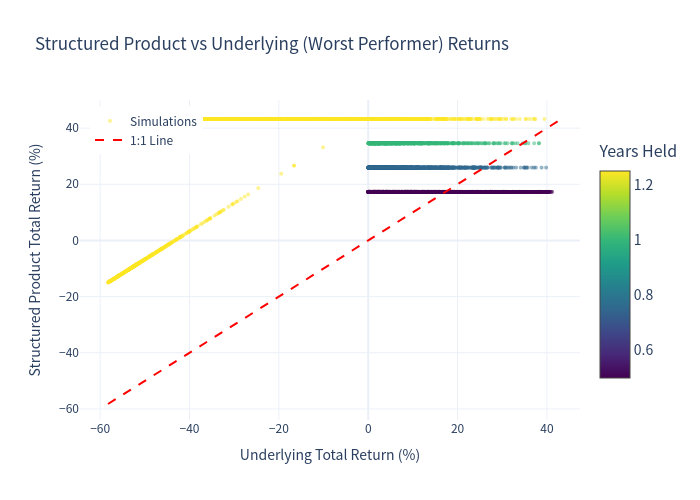
Each point represents one simulation. X-axis shows underlying (worst performer) total return; Y-axis shows structured product total return. Color indicates years held.
Annualized Return Histograms
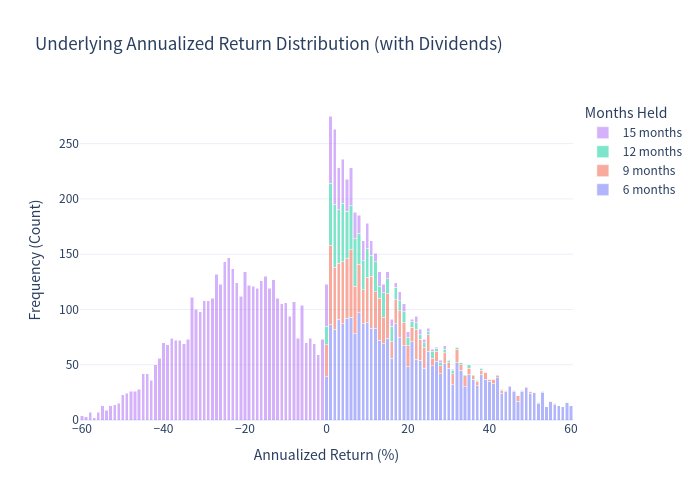
Underlying (Worst Performer with Dividends)
Structured Product
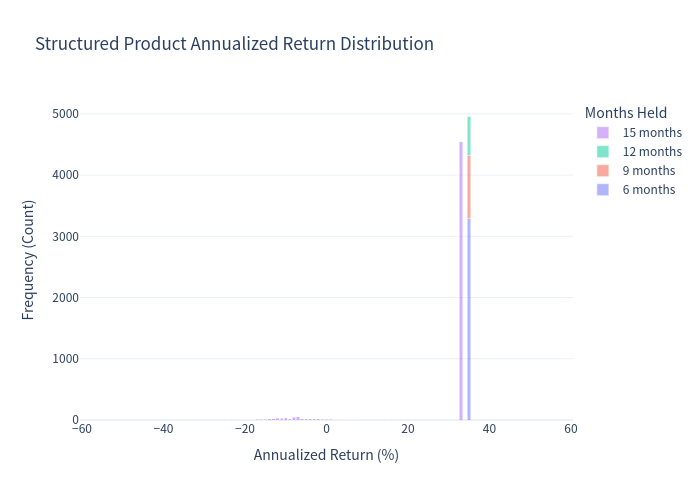
Histograms show the distribution of annualized returns, stacked by holding period (months). Bin size: 1%.
Scenario Probability Bar Chart
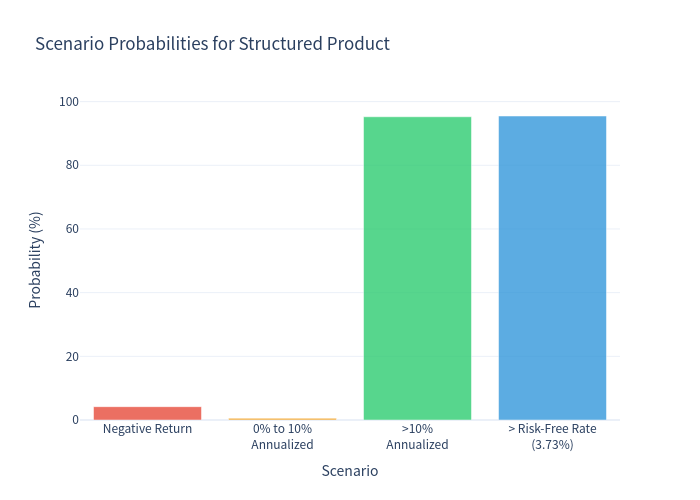
Probability of different outcome scenarios for the structured product.
Risk vs Return Comparison
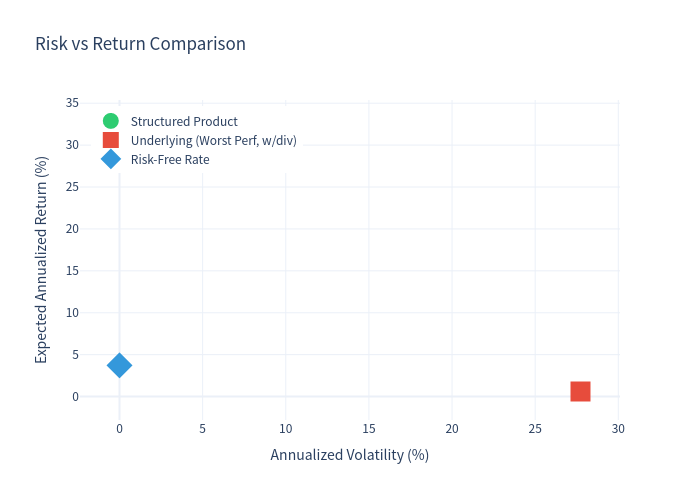
Expected annualized return vs annualized volatility for the structured product, the underlying (worst performer with dividends), and the risk-free rate.
Box Plot Comparison
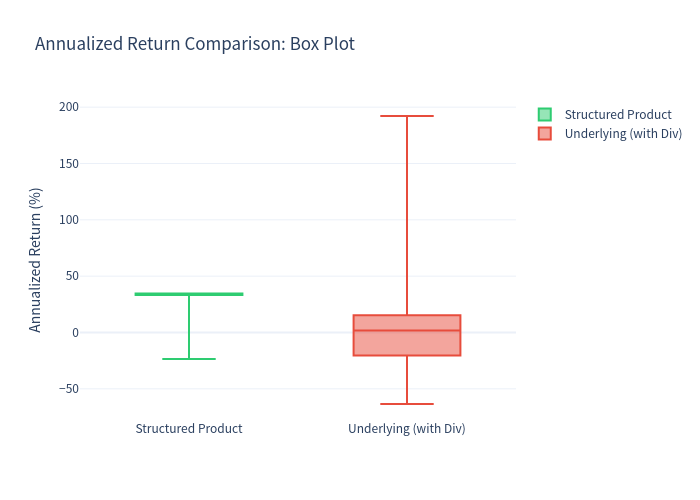
Distribution of annualized returns for the structured product and the underlying (with dividends).
Holding Period Distribution
Coupons Received Distribution
Investment Commentary
Key Strengths
- Very high coupon yield of 34.60% p.a., paid quarterly regardless of underlying performance.
- Significant downside buffer of 51% (barrier at 49%) before capital is at risk.
- Strong risk-adjusted returns with expected annualized return of ~32% and relatively low volatility (~9%) compared to the underlying basket (~28%).
- Very low probability of loss (~4.2%) due to the high coupon income cushion and deep barrier.
- High probability of outperforming both the risk-free rate (~95.5%) and the underlying stocks directly.
Key Risks
- Issuer call risk: The product can be called early (estimated ~50% probability), limiting total coupon collection to fewer periods.
- Tail risk of barrier breach: If either stock falls more than 51%, the barrier is triggered and the investor may receive physical shares of the worst performer at a loss. NBIS in particular is a highly volatile stock (~110% annualized volatility historically).
- Short holding periods when called mean annualized return figures can appear high, but total absolute return is lower (e.g., 8.65% over 6 months).
- Single name concentration risk: The product is linked to only two stocks; a severe decline in either impacts the payoff.