
Contingent Income Auto-Callable Securities due November 2, 2029
Worst-of EURO STOXX 50® Index, Russell 2000® Index and S&P 500® Index — Principal at Risk
Simulation-based evaluation (10,000 Monte Carlo scenarios). Base currency USD.
Headline Simulation Results
| Metric | Result |
|---|---|
| Expected annualized return (CAGR) | 8.90% |
| Expected total return over the (variable) holding period | 6.94% |
| Probability of a negative return | 4.51% |
| 99% confidence VaR (1-year) | -17.37% |
| Expected annualized volatility | 5.26% |
| Expected holding period | 12.77 months (≈1.06 years) |
| Probability of automatic early redemption | 87.58% |
The note is a worst-of, quarterly contingent-coupon, auto-callable, principal-at-risk structure. In the base case it offers an attractive running yield, but the risk is concentrated in the worst-performing of three equity indices.
Because more than half of scenarios are automatically called at the first call date (6 months), many per-simulation returns are annualized from a very short horizon. This inflates both the product's and the underlying's annualized figures. The total return over the realized holding period (product 6.94% vs. underlying 11.37%, on average) and the expected holding period are the more reliable summary. The 87.58% autocall rate is itself a consequence of the strong rising-market drift assumed in the simulation.
What This Product Is
Issuer / Guarantor: Morgan Stanley Finance LLC / Morgan Stanley. Stated principal: $1,000 per note. Not principal-protected.
How it works (plain language)
- Coupon: Each quarter, you receive a contingent coupon — a 10.05%–11.05% annual rate (base case 10.55%, ≈2.64% per quarter) — only if all three indices close at or above 80% of their starting level on the observation date. If any index is below 80%, you get no coupon that quarter (it is not paid later).
- Early redemption: Starting after 6 months (April 2027) and quarterly thereafter, if all three indices are at or above 100% of their starting level, the note is automatically called: you receive your $1,000 principal back plus that quarter's coupon, and the note ends.
- At maturity (if never called): If all three indices finish at or above 70% of their starting level, you get your $1,000 back (plus the final coupon, if payable). If any index finishes below 70%, you lose 1% of principal for every 1% the worst-performing index is below its start — a large loss, potentially approaching total loss of principal.
- Upside is capped: You do not participate in index gains beyond the coupons.
Because it is worst-of, a decline in any single index can trigger a lost coupon or a principal loss, even if the other two indices rise. There is no diversification benefit.
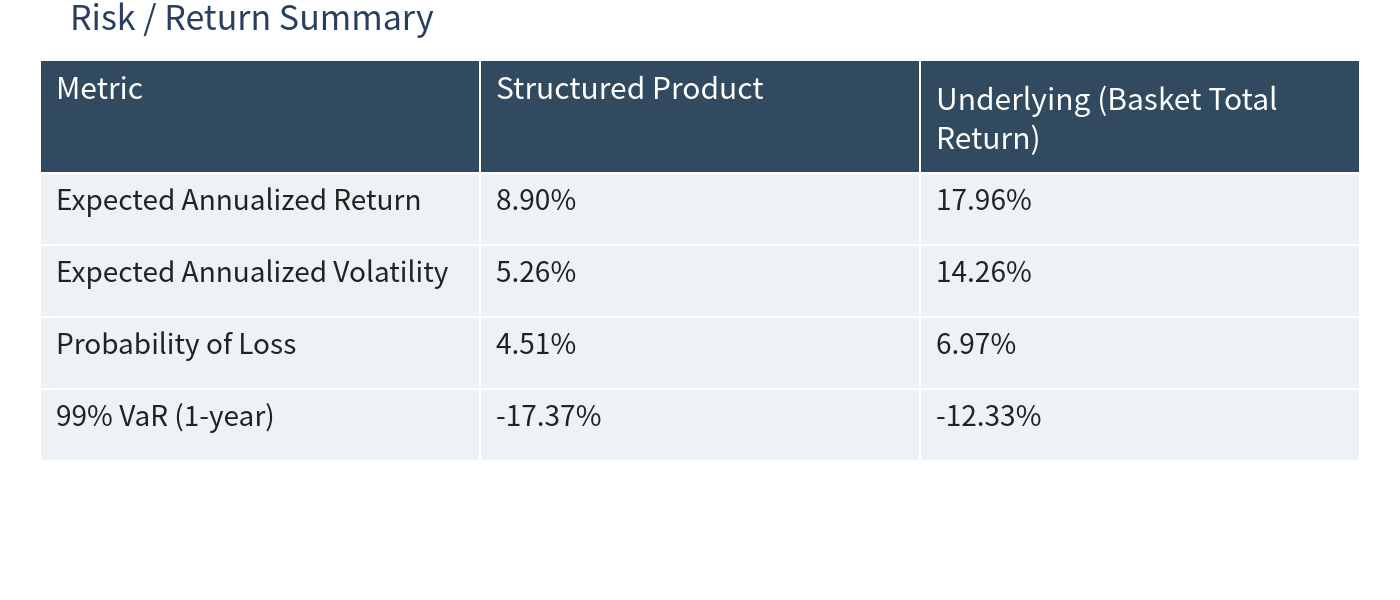
Key Statistics — Structured Product vs. Underlying Benchmark
The benchmark is an equal-weighted basket of the three indices (total return, including dividends), evaluated over the same holding period as the product in each simulation.
| Metric | Structured Product | Underlying (Basket, Total Return) |
|---|---|---|
| Expected annualized return | 8.90% | 17.96% |
| Expected annualized volatility | 5.26% | 14.26% |
| Probability of loss | 4.51% | 6.97% |
| 99% VaR (1-year) | -17.37% | -12.33% |
Summary Table
Reading the numbers
The product delivers a steady coupon-driven return with roughly one-third of the benchmark's volatility and a high probability of beating cash (93.39% of scenarios exceed the 3.84% risk-free rate). In exchange, it caps upside and — because it is worst-of and provides no buffer below the 70% barrier — its deep-tail loss (99% VaR -17.37%) is actually worse than the diversified equal-weight basket (-12.33%). The headline expected return is lower than the benchmark precisely because the product captures only coupons in strongly rising markets, while the benchmark keeps full upside.
Simulation Results & Charts
1. Outcome Scatter — Product vs. Underlying Return
Each point is one simulation; color indicates years held. Points above the dashed 1:1 line are scenarios where the product beat the underlying.
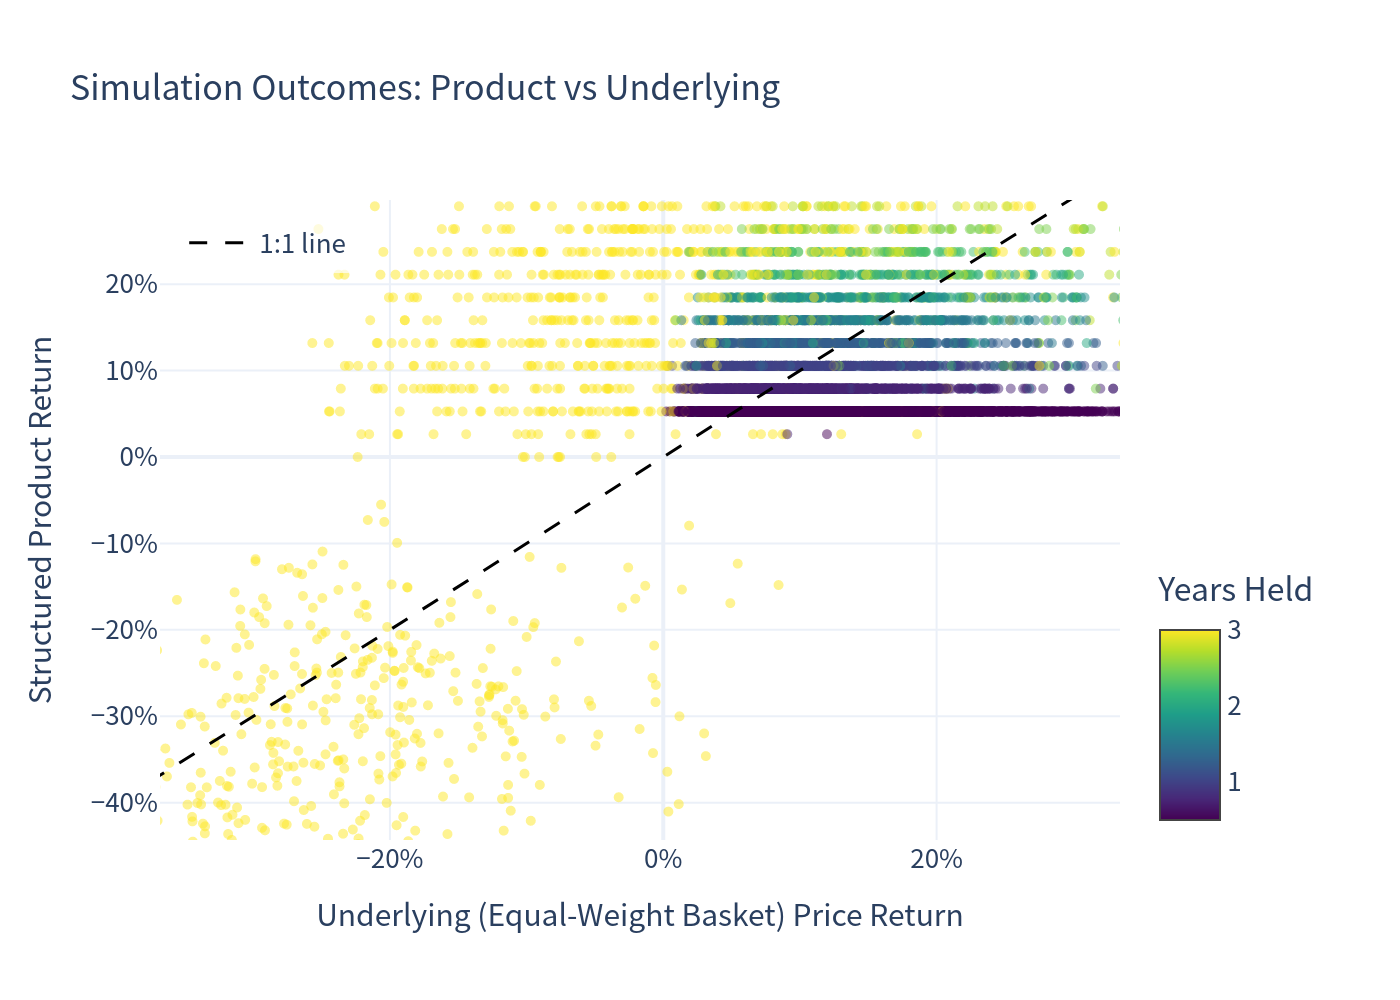
Figure 1 — Outcome scatter: product vs. underlying return
- In down / flat markets the product sits above the 1:1 line (coupons plus, in mild declines, principal protection cushion it).
- In strong rallies the product bends below the 1:1 line: early redemption caps the product near par-plus-coupons while the underlying keeps rising.
2. Simulated Annualized Return Distributions (1% bins, stacked by holding period)
Underlying (basket, total return)
A wide, right-skewed spread reflecting full equity upside and downside.
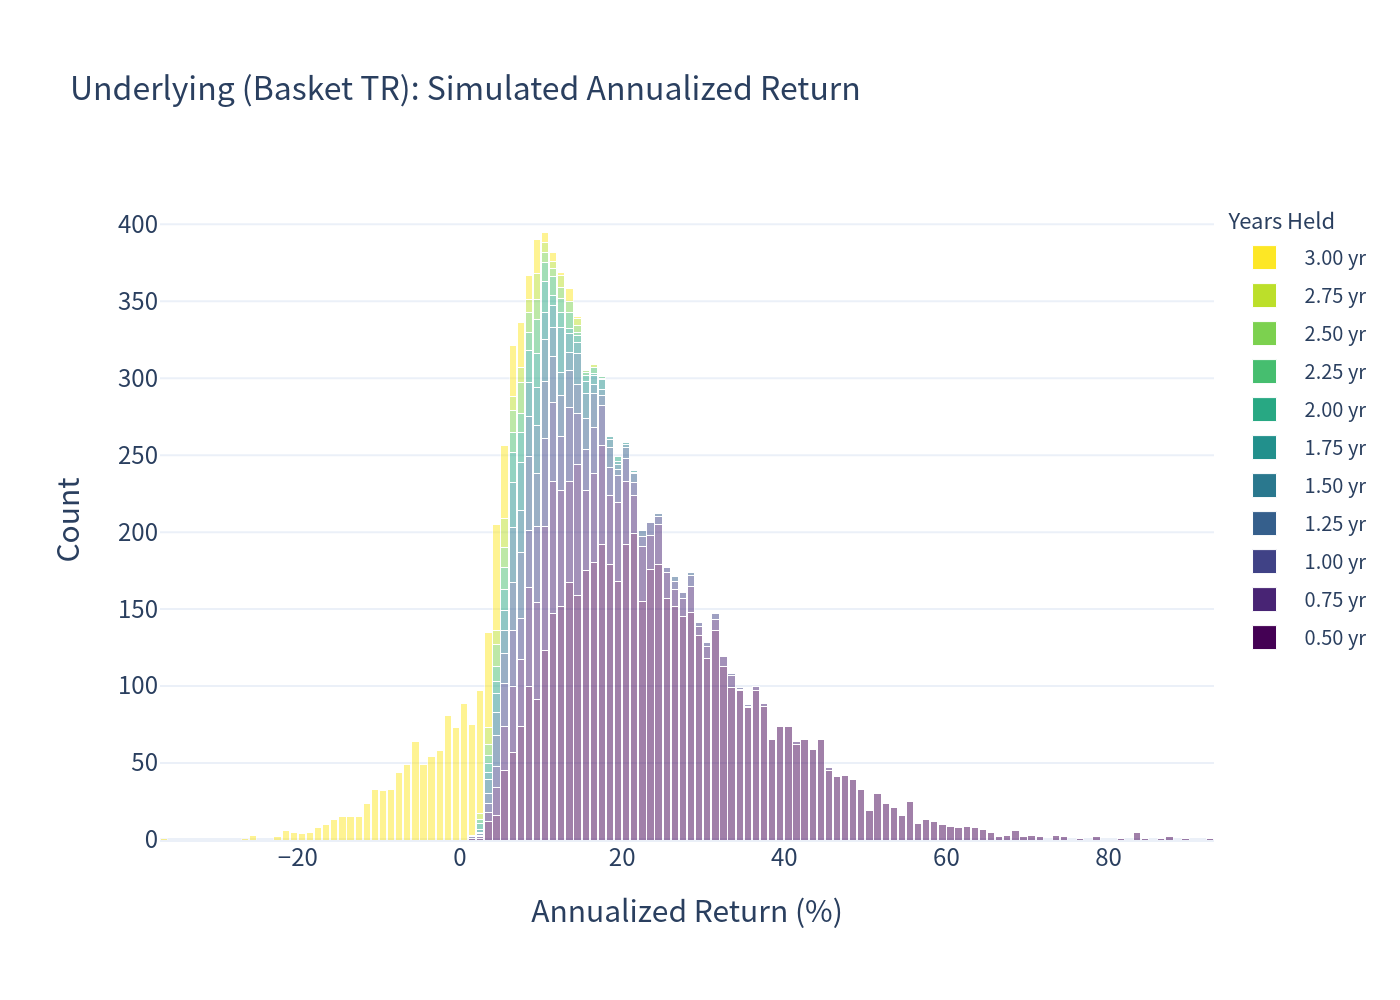
Figure 2 — Simulated annualized return distribution: underlying basket
Structured product
A tight cluster near the coupon level (~10.5%) from early redemptions, plus a left tail from notes that run to maturity in falling markets.
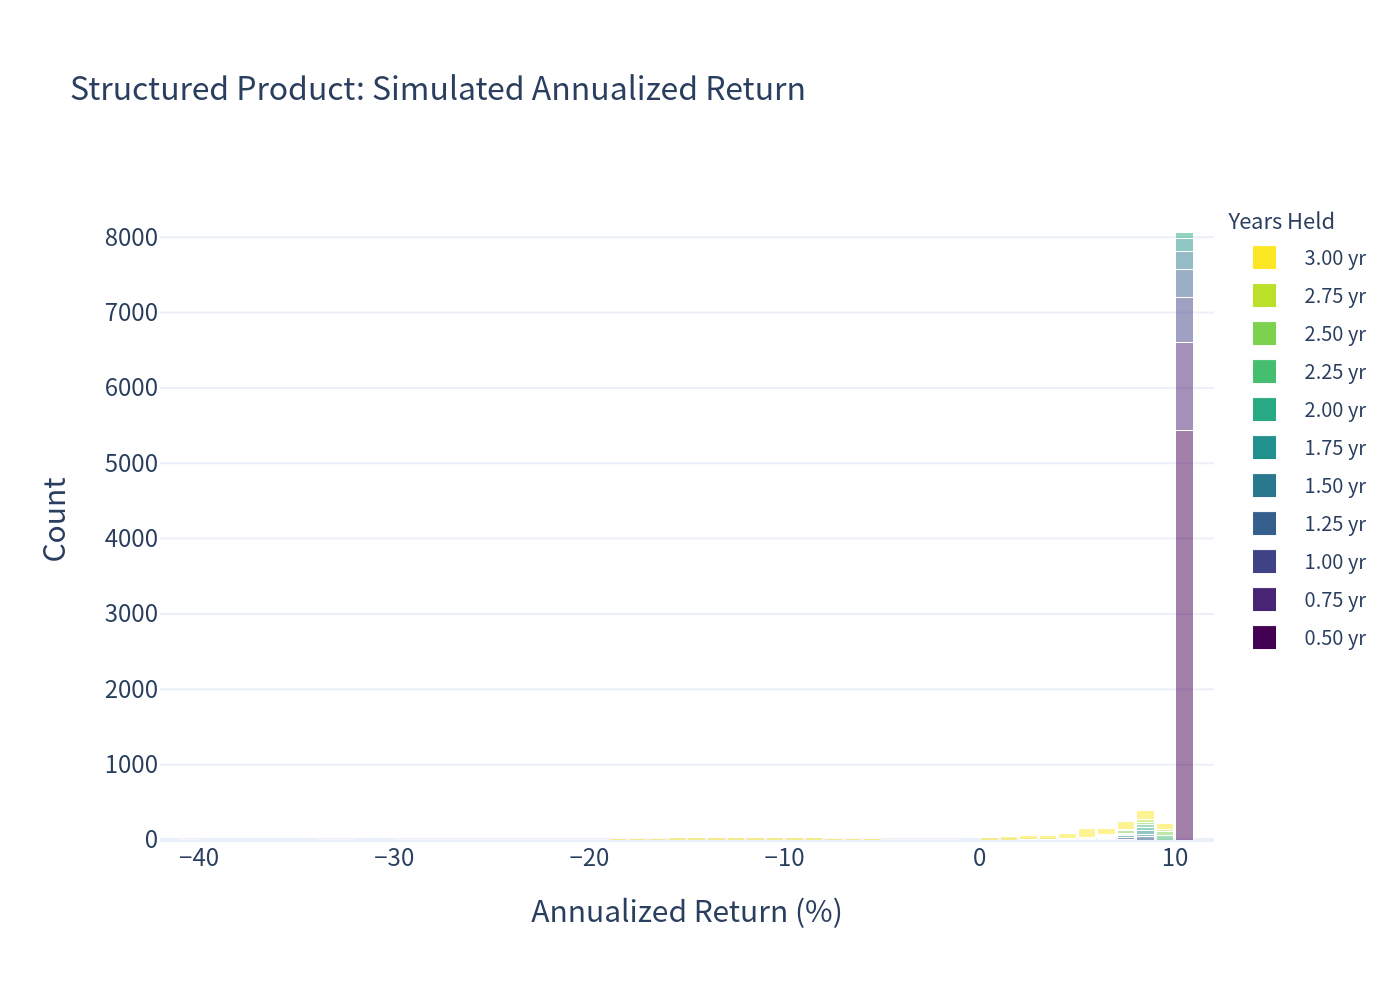
Figure 3 — Simulated annualized return distribution: structured product
3. Risk / Return Profile
Expected annualized return vs. expected annualized volatility. The product occupies a low-volatility position, close to the return of a bond-like asset with a fraction of equity risk.
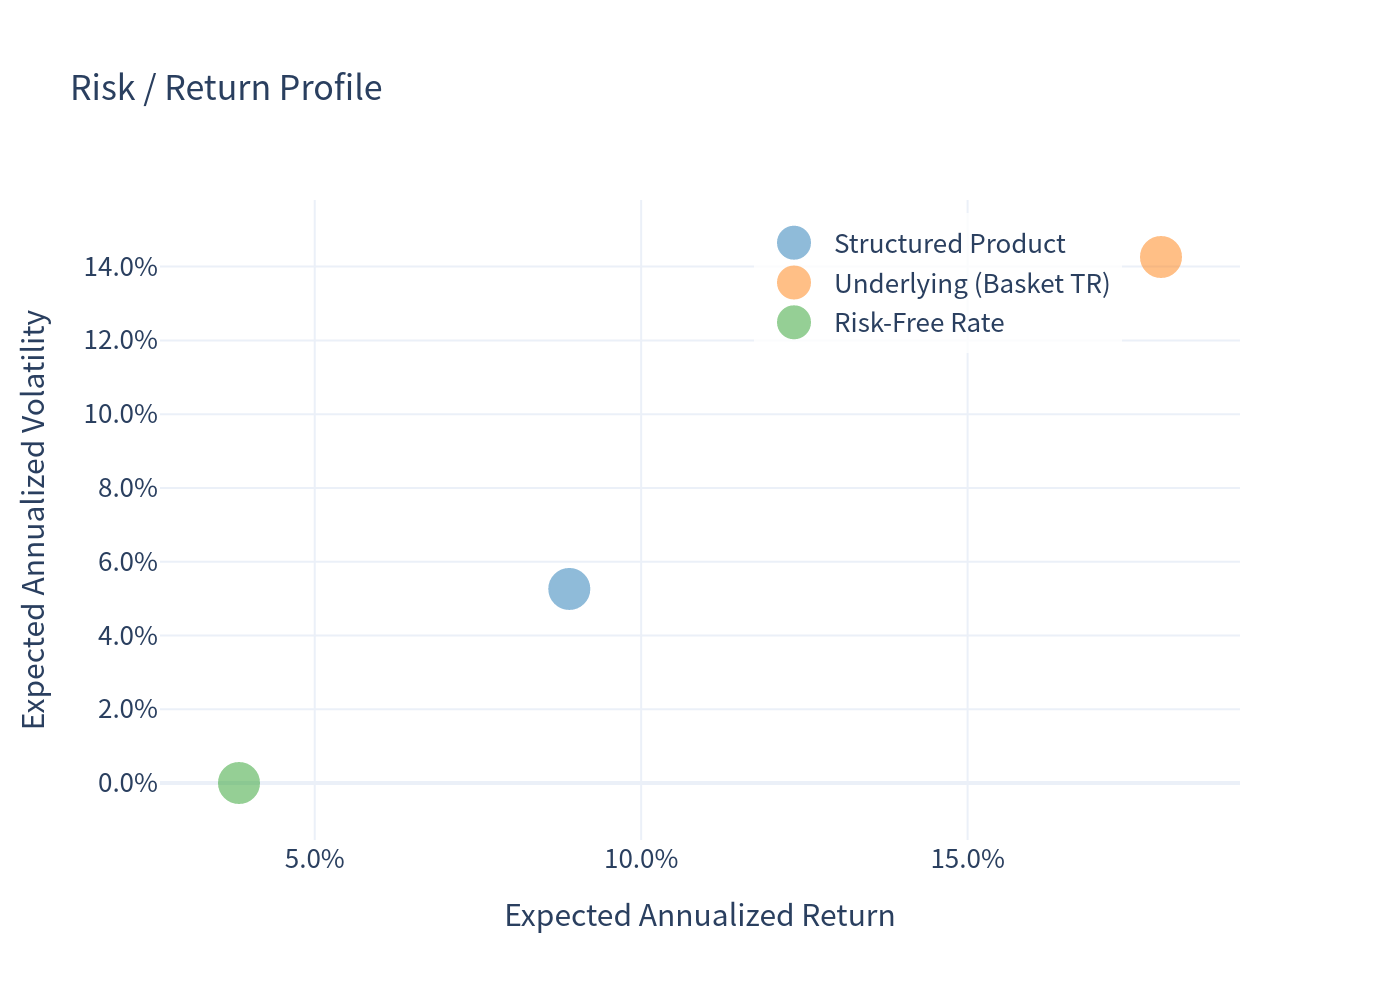
Figure 4 — Risk / return profile
4. Scenario Probabilities
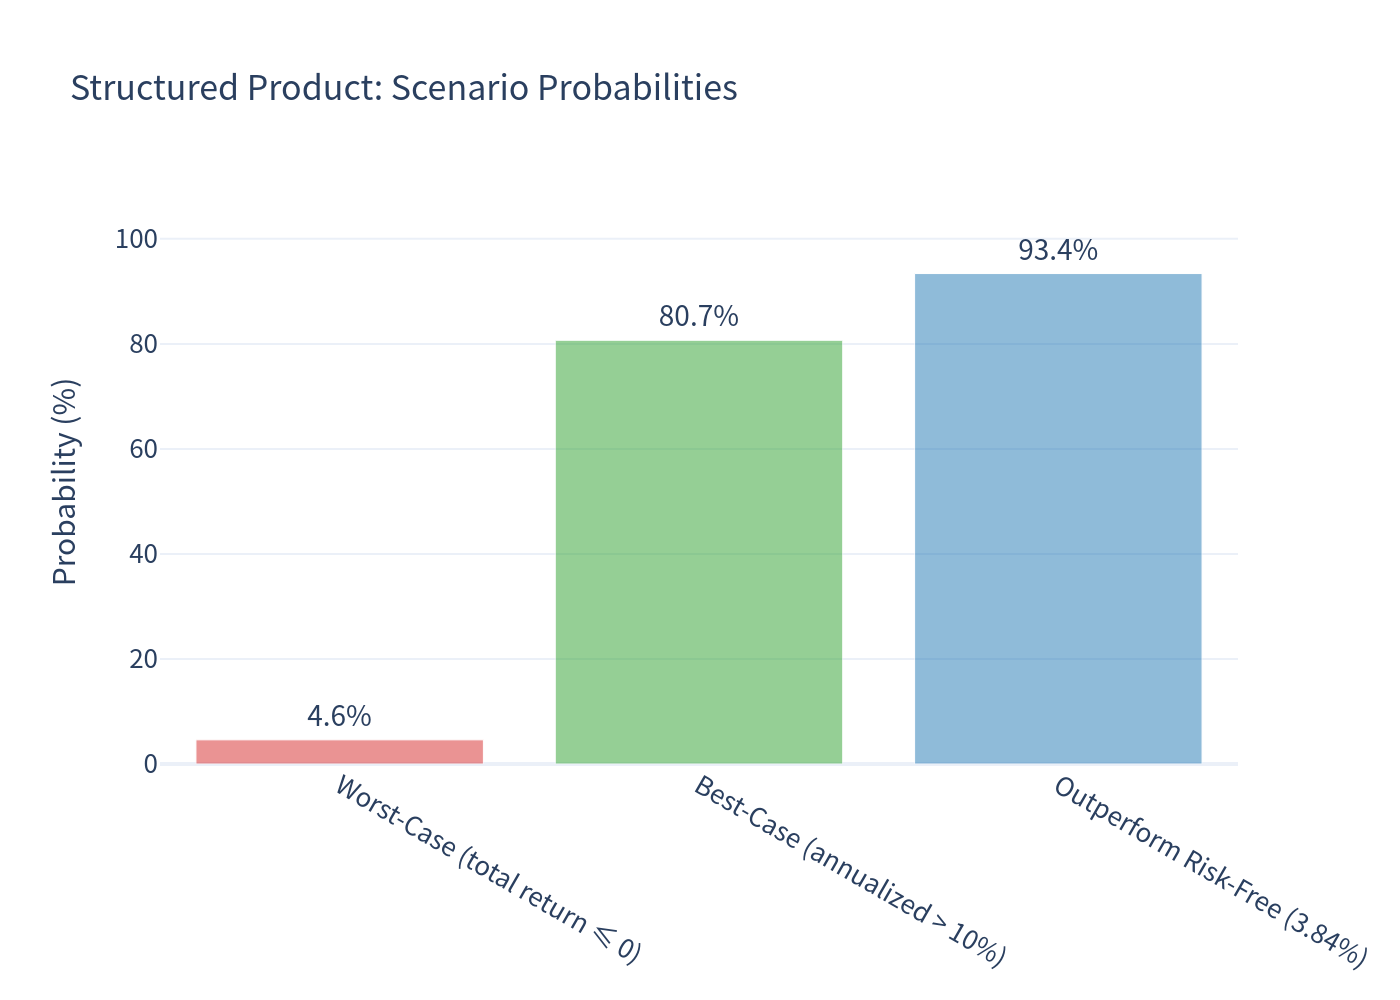
Figure 5 — Scenario probabilities
| Scenario | Probability |
|---|---|
| Worst-case: total return ≤ 0% | 4.60% |
| Best-case: annualized return > 10% | 80.69% |
| Outperforms the risk-free rate (3.84%) | 93.39% |
5. Annualized Return Box Plot
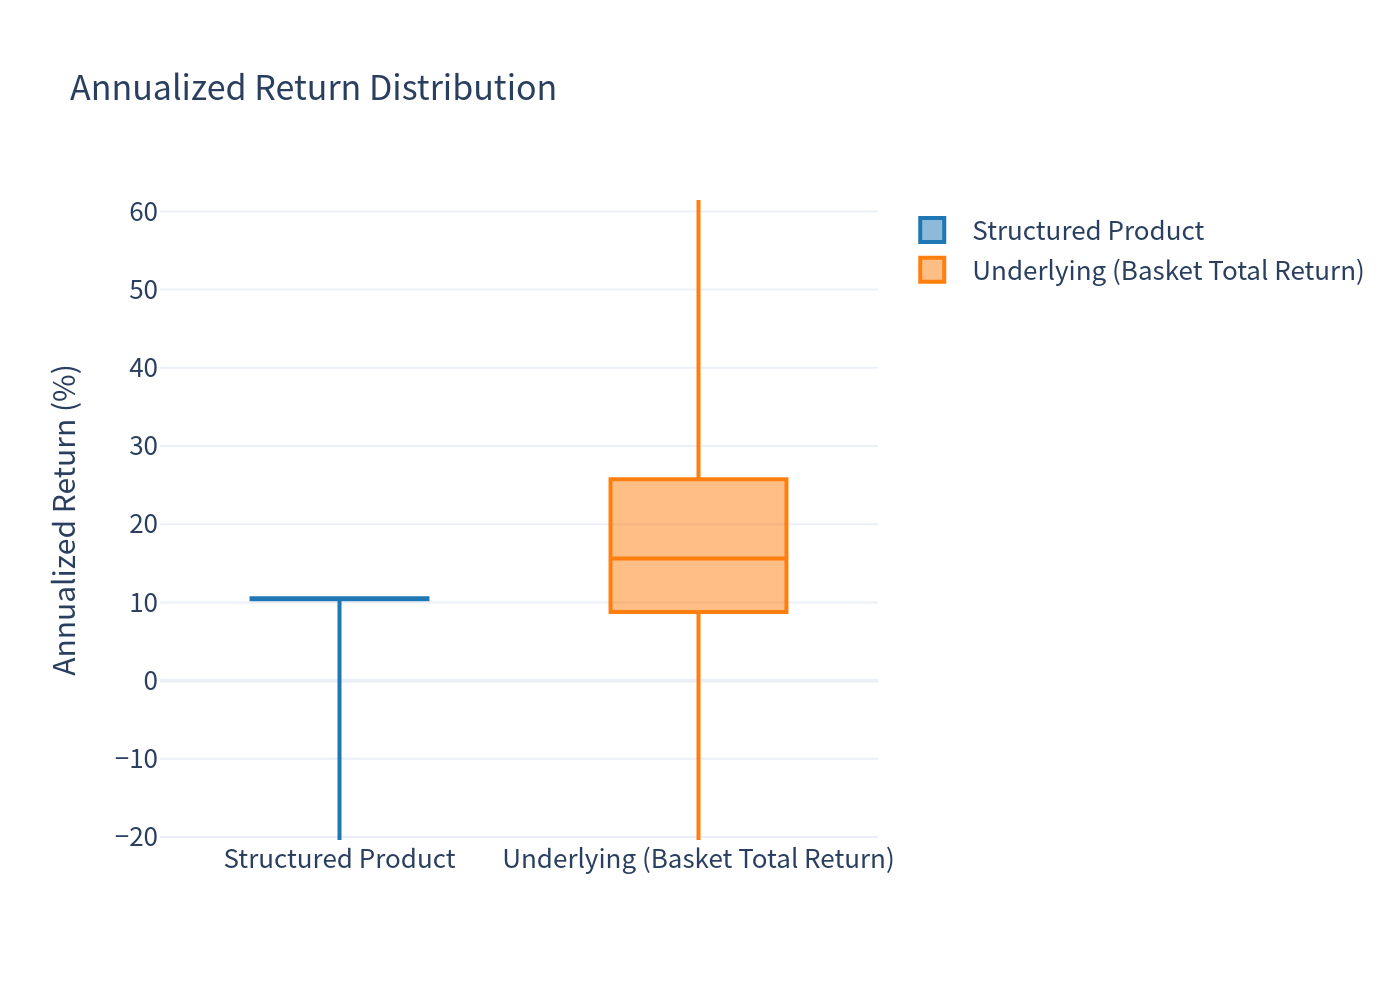
Figure 6 — Annualized return box plot
The product's interquartile range is narrow and centered on the coupon rate; the benchmark's distribution is far wider and more skewed.
6. Holding Period and Coupon Outcomes
Holding Period
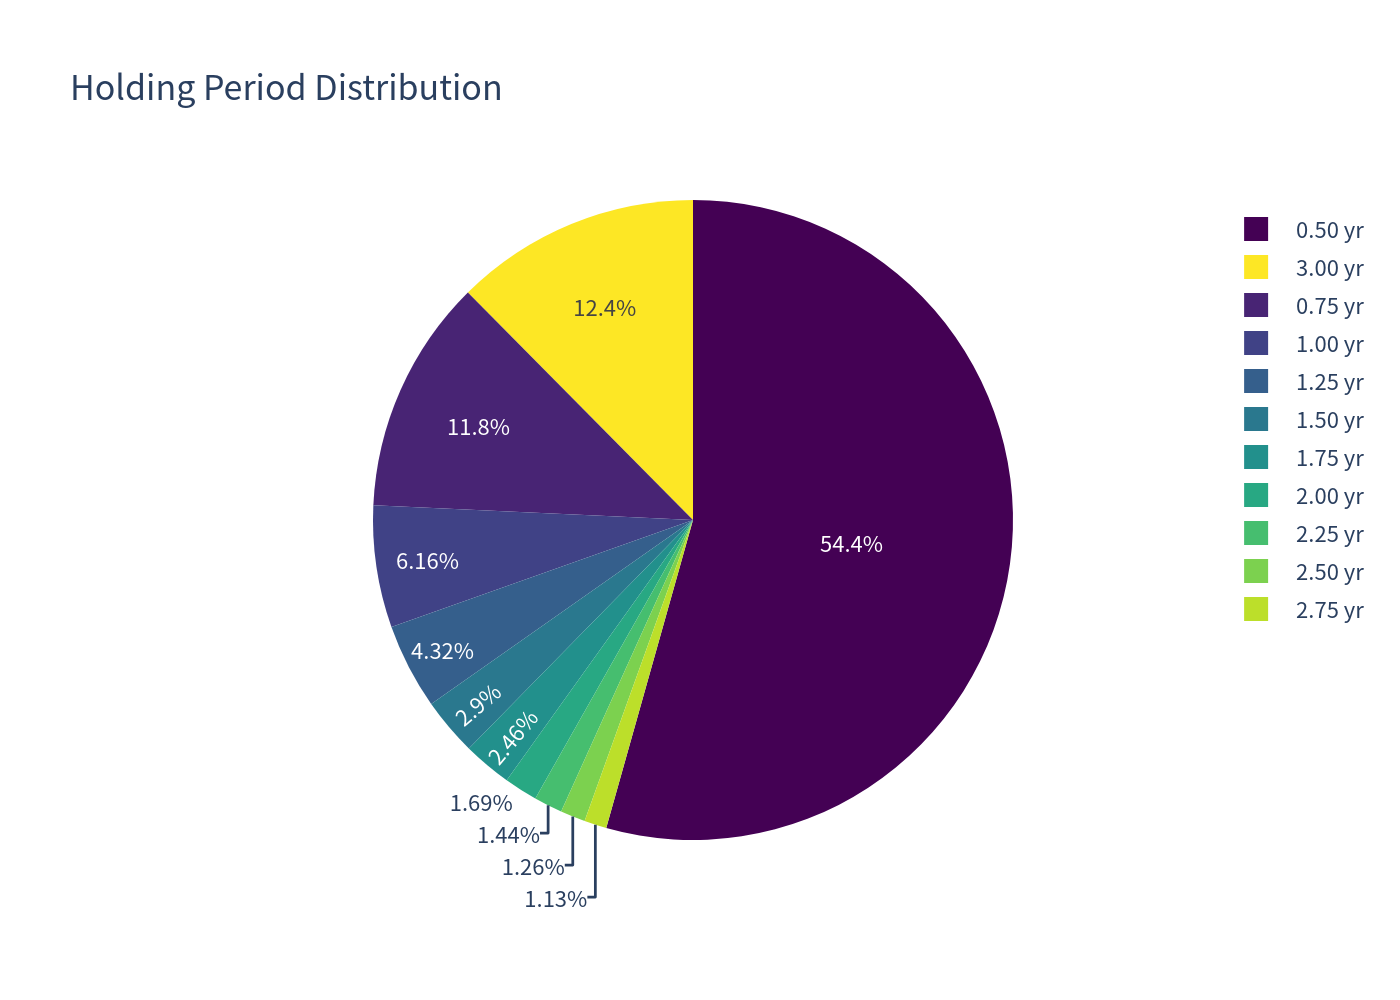
Figure 7 — Holding period distribution
Coupon Outcomes
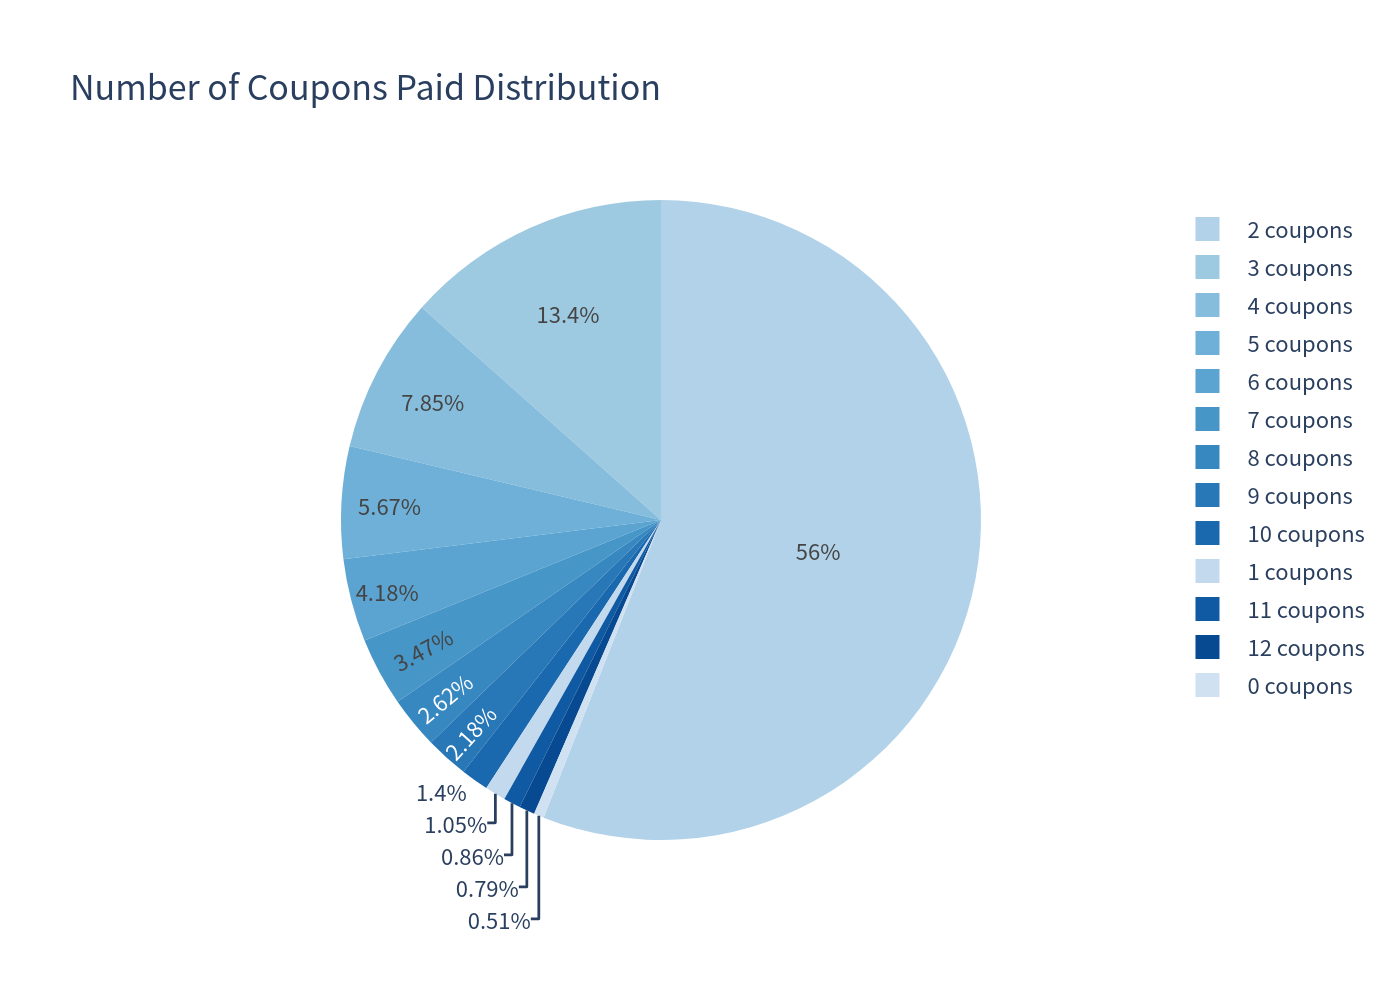
Figure 8 — Coupon outcome distribution
- Holding period: ~54% of scenarios are called at 6 months (first call date); only ~12% run the full 36 months to maturity. Median holding period ≈ 6 months.
- Coupons: ~99.5% of scenarios collect at least one coupon; the mode is 2 coupons (the two quarters before a first-date autocall). The 0.5% that collect nothing are deep, sustained declines.
Investment Commentary
Potential benefits
- Attractive, high running yield (10.05%–11.05% p.a.) versus cash, provided the worst index stays above 80%.
- Frequent early redemption — the strong majority of scenarios return principal quickly, compressing exposure time.
- Meaningful volatility reduction (~5.3% vs. ~14.3% for the basket) and a high likelihood of beating the risk-free rate.
- Conditional downside buffer: above the 70% barrier, principal is returned in full even if indices are moderately down.
Risks and drawbacks
- Worst-of concentration: a single underperformer drives lost coupons and principal losses; no diversification benefit across the three indices.
- No buffer below the 70% barrier: a plunge in the worst index translates ~1:1 into principal loss, and the 99% VaR (-17.37%) is deeper than the diversified basket's, so the tail is not protected by the "protection" feature in severe sell-offs.
- Deeply path- and barrier-dependent coupon: any quarter with an index below 80% forfeits that coupon permanently.
- Capped upside with no equity participation, plus full issuer/credit exposure to Morgan Stanley.
- Scenario results are sensitive to the assumed equity risk premium; a weaker forward market would lower autocall frequency, extend holding periods, and raise the odds of principal loss.
This document is a quantitative evaluation of the simulated outcomes only and does not constitute investment advice or a suitability assessment.